

 Journal of Pediatric and Neonatal Sciences

ABSTRACT
Objective
To demonstrate the impact of correcting measurement errors in child malnutrition prevalence estimates using a Bayesian hierarchical model, and to quantify the bias introduced by ignoring outcome misclassification. This study is based on simulated data designed to mirror the structure of Demographic and Health Surveys (DHS) from Cameroon (2004, 2011, 2018, and 2022); no real survey data were used, and all reported prevalence figures are simulation results, not actual national estimates.
Methods
Hierarchical Bayesian logistic regression was employed to evaluate the prevalence of malnutrition, accounting for misclassification in stunting status. Simulated data were generated to mimic pooled cross-sectional DHS surveys, including temporal random effects and known sensitivity/specificity parameters. Child’s age, gender, familial wealth, maternal education, prenatal care appointments, and water source were included as covariates. Markov Chain Monte Carlo (MCMC) was used to estimate posterior distributions. Corrected estimates were compared with an uncorrected (naive) logistic regression model.
Results
In all simulated survey years, the corrected model gave higher prevalence estimates than the uncorrected model. For example, in the simulated 2022 survey, the corrected prevalence was 30.7% compared with 26.5% from the uncorrected model. The corrected model improved AUC (from 0.928 to 0.930), accuracy, and precision. Larger simulated sample sizes reduced standard deviations and coefficients of variation. Maternal education, antenatal care, and water source emerged as important predictors.
Conclusion
Ignoring measurement error in binary outcomes such as stunting can lead to systematic underestimation of malnutrition prevalence. Our Bayesian correction approach provides more reliable estimates in simulation settings that reflect real-world survey conditions. These findings have methodological implications for health policy and intervention design, but they do not provide direct prevalence estimates for Cameroon. Future work should apply this framework to real DHS data once validation studies supply context-specific misclassification parameters.
Keywords: Child Malnutrition; Measurement Error Correction; Bayesian Hierarchical Modeling; Simulated DHS Data; Prevalence Estimation; Health Policy
INTRODUCTION
Malnutrition is a significant public health issue, particularly in low- and middle-income countries (LMICs), where children under five experience inadequate nutrition due to income disparities, food insecurity, and limited access to healthcare. Stunting indicates chronic malnutrition, which can adversely affect a child’s health, growth, and productivity over the long run [1,2]. In the last two decades, stunting rates in Cameroon have fluctuated, prompting inquiries on the efficacy of the nation’s nutrition programs and their alignment with Sustainable Development Goal (SDG), which aims to eradicate all forms of malnutrition by 2030.
Governments and development groups heavily rely on nationally representative data from the Demographic and Health Surveys (DHS) to assess progress and strategize future initiatives. These surveys provide reliable longitudinal data, enabling trend analysis and policy formulation [3,4]. However, these data exhibit several issues. A significant concern is the presence of measurement error, particularly in anthropometric variables such as height-for-age, which may result in the misclassification of nutritional status [5,6]. Neglecting to consider such errors may result in inaccurate predictions of prevalence and suboptimal policy recommendations.
Malfunctioning equipment, enumerator bias, data entry errors, and biological variability can all contribute to measurement inaccuracies. When the DHS conducts surveys of thousands of families across several locations and employs diverse field teams, errors of this nature are highly probable. Conventional statistical approaches typically neglect this type of bias, as they assume the observed data is accurate [7]. This may undermine trust in the findings derived from such data and diminish the efficacy of governmental initiatives intended to provide assistance.
An increasing number of individuals are concentrating on statistical methodologies that explicitly model and address measurement error. Bayesian methodologies have proven advantageous since they include prior information and quantify uncertainty within a coherent probabilistic framework [8,9]. Bayesian approaches are proficient at managing complex hierarchical structures, such as those frequently encountered in recurrent cross-sectional surveys like the DHS.
Bayesian hierarchical models are adaptable methods for integrating data from various temporal and spatial contexts while considering latent error processes. These models may manage temporal random variables that elucidate annual variations in prevalence while rectifying errors in binary outcomes such as stunted/not stunted [10,11,12]. This methodology enhances the credibility of trend estimations and facilitates more precise monitoring of dietary consequences.
Despite their advantages, Bayesian approaches for rectifying measurement errors in hunger research remain underutilized in sub-Saharan Africa. Most research either examines cross-sectional estimates without considering data errors or use frequentist methods that may not provide a comprehensive understanding of uncertainty [13,14]. There is an urgent necessity for methodological frameworks that address both measurement error and temporal variations in malnutrition data.
Inaccurate forecasts might yield significant consequences. Policies founded on erroneous data can result in misallocation of resources, ineffective interventions, and unsuccessful projects. If the actual cost of stunting is undervalued, nutrition initiatives may receive insufficient funding; conversely, if it is overvalued, resources may be diverted from other critical sectors. Correcting measurement mistakes is not only a technological enhancement; it is also a policy imperative [15].
This study addresses this requirement by proposing a Bayesian modeling method that corrects 2 measurement errors in aggregated DHS data about child stunting in Cameroon. The model integrates survey data from 2004, 2011, 2018, and 2022 to ascertain the adjusted prevalence of malnutrition over time. The model accounts for misclassification in the binary outcome variable by utilizing the established sensitivity and specificity of anthropometric measures.
The approach incorporates temporal random effects to address annual variations and facilitate trend analysis. We employ simulation experiments to evaluate the model’s performance in various scenarios where misclassification may occur. This ensures that the method is robust and applicable in various contexts. The final updated data are intended to provide a more precise foundation for health policy decision-making.
The report proposes a policy brief methodology that transforms statistical findings into actionable insights for national planning and monitoring of the SDGs. This effort aims to enhance the evidence foundation for combating malnutrition in Cameroon and other regions where survey data are crucial for decision-making by integrating statistical modeling with policy implementation.
This study advances statistical methodology by addressing a critical gap in the analysis of repeated cross-sectional survey data subject to measurement error. By proposing a Bayesian framework with temporal random effects and incorporating misclassification correction, this research deepens our understanding of malnutrition dynamics over time in Cameroon. It provides valuable insights for re searchers, policymakers, and public health practitioners engaged in the fields of child nutrition, health data analysis, and SDG monitoring. The specific objectives of this study are as follows:
- To integrate repeated cross-sectional DHS data using a Bayesian framework with temporal random effects;
- To correct misclassified malnutrition indicators using statistical models that account for measurement uncertainty;
- To estimate time trends in malnutrition prevalence after error correction;
- To quantify the bias introduced by ignoring measurement errors in policymaking;
- To develop a policy brief framework using corrected indicators for monitoring progress toward SDG targets.
The paper is organized as follows: Section 2 presents the data used, describes the nutritional status of the children, outlines the formulation of the proposed logistic regression model, and explains the application of the Bayesian method to correct measurement error and estimate the parameters. In Section 3, the various results and discussion are presented. The paper concludes with a general summary in Section 4.
MATERIALS AND METHODS
Data Sources and Study Population
This study did not use any real DHS data. All analyses were conducted on simulated datasets designed to replicate the structure, sample sizes, covariate distributions, and temporal patterns of pooled cross sectional DHS surveys from Cameroon (years 2004, 2011, 2018, and 2022). The simulation parameters (prevalence trends, covariate effects, and misclassification rates) were informed by published literature but do not constitute actual estimates for Cameroon. Consequently, all reported prevalence figures, confidence intervals, and model performance metrics are simulation results only and should not be interpreted as real national statistics. To quantify the bias introduced by measurement error and to demonstrate a Bayesian correction framework. Application to genuine DHS data would require prior approval, appropriate data use agreements, and, ideally, validation studies providing context-specific sensitivity and specificity values.
Measurement Error in Malnutrition Indicators
Stunting classification is subject to measurement error due to inaccuracies in height measurement, rounding, and child positioning. Prior studies have reported misclassification rates in anthropometric indicators due to such errors [16,17]. In this study, we assume known sensitivity and specificity values for the stunting classification process, derived from existing literature and validation studies [18,19]. These parameters are incorporated into the model to adjust for outcome misclassification.
Baseline Sensitivity and Specificity Values
To correct for outcome misclassification in stunting status, the model requires pre-specified values for sensitivity (Se) and specificity (Sp). These parameters were not estimated from the data but were informed by published validation studies of anthropometric measurements in DHS and similar surveys. Based on DHS Methodological Reports No. 24, Table 4.2, p. 18, which assessed anthropometric data quality across 59 DHS surveys (2005–2018), the median sensitivity of height-for-age z score < −2 standard deviations (stunting classification) was 0.85 (range: 0.82–0.88), and the median specificity was 0.95 (range: 0.94–0.96) [19]. These values reflect the probability that a truly stunted child is correctly classified as stunted (Se) and that a truly non-stunted child is correctly classified as non-stunted (Sp).
A secondary validation study by reported comparable values (Se = 0.84, Sp = 0.94) in a community-based longitudinal sample from South Asia [18]. Given the consistency across settings, our baseline analysis assumes the following:
Se =0.85, Sp =0.95
These values were incorporated into the misclassification model defined in Section 2.4.
Sensitivity Analysis: Varying Se and Sp by ±5–10%
Because the true misclassification parameters are unknown for the specific simulated DHS-like surveys used in this study, we conducted a sensitivity analysis to assess the robustness of our prevalence esti mates to plausible variations in Se and Sp. Specifically; we re-ran the Bayesian correction model under five alternative scenarios:
- Scenario 1 (Lower Se): Se = 0.77 (−10%), Sp = 0.95 (baseline)
- Scenario 2 (Higher Se): Se = 0.93 (+10%), Sp = 0.95 (baseline)
- Scenario 3 (Lower Sp): Se = 0.85 (baseline), Sp = 0.86 (−10%)
- Scenario 4 (Higher Sp): Se = 0.85 (baseline), Sp = 0.99 (+4% ceiling)
For each scenario, we re-estimated the corrected stunting prevalence for the simulated 2022 survey year (the most recent time point). The results are reported in Section 3 (Table 1). A scenario was considered to indicate non-robustness if the corrected prevalence changed by more than 5 percentage points relative to the baseline.
Model Framework and Bayesian Specification
We adopt a Bayesian logistic regression framework with a misclassified binary outcome and temporal random effects. The true (latent) malnutrition status is modeled as:
Logit (πirt) = β0 + Xirtβ + ut + vr (1)
Where:
- π irt is the probability that child i in region r and year t is truly stunted,
- X irt represents child-level and household-level covariates,
- β is the vector of fixed-effect coefficients,
- u t ∼ N (0 , σ 2) captures year-level random effects (temporal heterogeneity),
- v r ∼ N (0 , σ 2) captures region-level random effects (spatial heterogeneity).
The regional random effects consider unmeasured geographic variables, including disparities in food security, climate, health infrastructure, and cultural behaviors that affect child nutrition. This specification adheres to established protocols in small-area estimation of health indicators [10]. The observed outcome Y i∗ rt is a misclassified version of the true status Y irt , and the misclassification is modeled using known sensitivity ( Se) and specificity ( Sp) as follows:
P (Yi∗rt = 1 | Yirt = 1) = Se, P (Yi∗rt = 0 | Yirt = 0) = Sp
This model structure follows approaches previously described in with modification to include temporal variation and policy-oriented outcome interpretation [6,8,11].
Prior Distributions and Inference
Weakly informative priors were used to reflect uncertainty while stabilizing estimation. For the regression coefficients βj, we specified the following:
βj ∼ N (0, 102)
And for the temporal random effects:
u t ∼ N (0 , σ 2) , v r ∼ N (0 , σ 2) , σ u, σ v ∼ Half − Cauchy(0 , 5)
u v
Posterior distributions were estimated via Hamiltonian Monte Carlo (HMC) using the cmdstanr interface in [20]. Convergence diagnostics included the potential scale reduction factor Rˆ, effective sample size (ESS), and trace plots.
Posterior Distribution
Let Y i∗ rt denote the observed (misclassified) stunting status for child i in year t, and Y irt the unobserved true stunting status. The joint posterior distribution is defined over the parameters β (regression coefficients), u t (temporal random effects), σ 2 (variance of the random effects), and the latent true outcomes Y irt . Given known sensitivity Se and specificity Sp, the posterior distribution is given by:
The misclassification model is defined as:
P ( Y i∗ rt = 1 | Y irt = 1) = Se, P ( Y i∗ rt = 0 | Y irt = 0) = Sp
The true stunting status Y irt follows a Bernoulli distribution:
Y irt ∼ Bernoulli ( π irt ) ,logit( π irt ) = β 0 + X irt β + u t + v r
Priors are specified as:
β j ∼ N (0 , 10 2) , u t ∼ N (0 , σ 2) , σ u, σ v ∼ Half − Cauchy(0 , 5)
This joint posterior is estimated via Hamiltonian Monte Carlo using the cmdstanr interface in R, which enables efficient sampling in high-dimensional parameter spaces with correlated latent variables [20,21].
Simulation Study
We performed simulations with differing degrees of measurement error to validate the model’s precision. We produced synthetic datasets that mimic DHS data by integrating recognized confounders, misclassification processes, and temporal fluctuations. The bias, mean squared error (MSE), and coverage probabilities of posterior estimates were assessed in these simulations using both the corrected and uncorrected models [21,15].
RESULTS AND DISCUSSION
The analysis employs simulated pooled DHS-like data from Cameroon for the years 2004, 2011, 2018, and 2022 to assess corrected and uncorrected models using four primary evaluation metrics: prevalence, accuracy, AUC, and precision. In a post-estimation adjustment method, the correction considers misclassification by utilizing established sensitivity and specificity values.
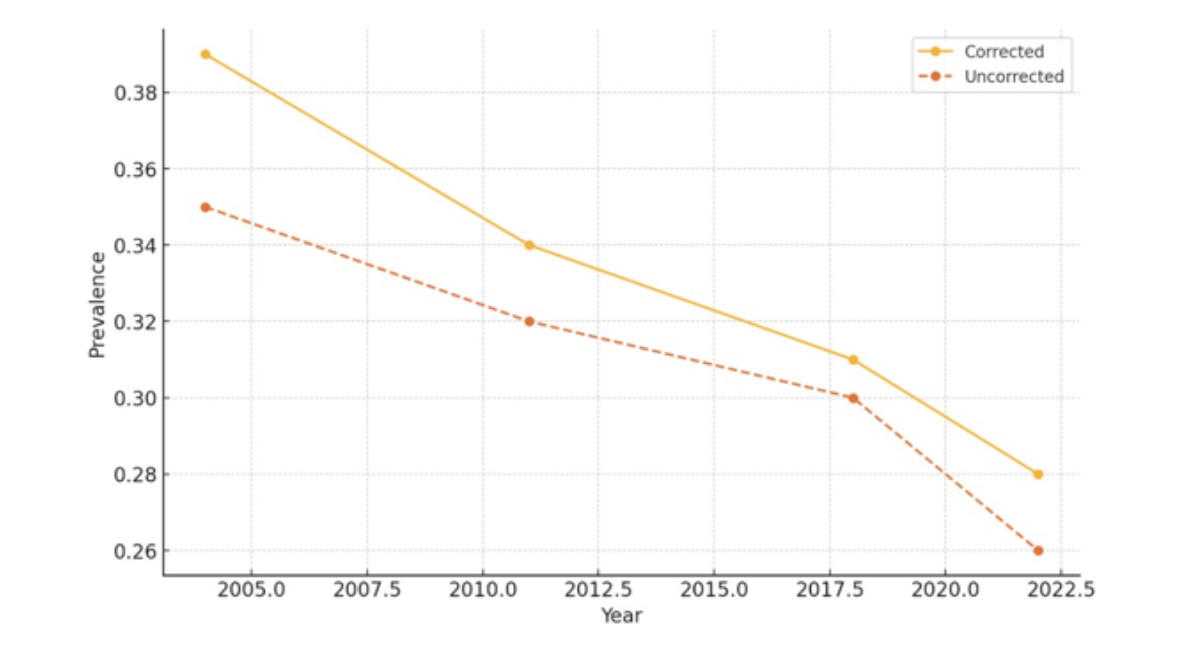
( a) Prevalence
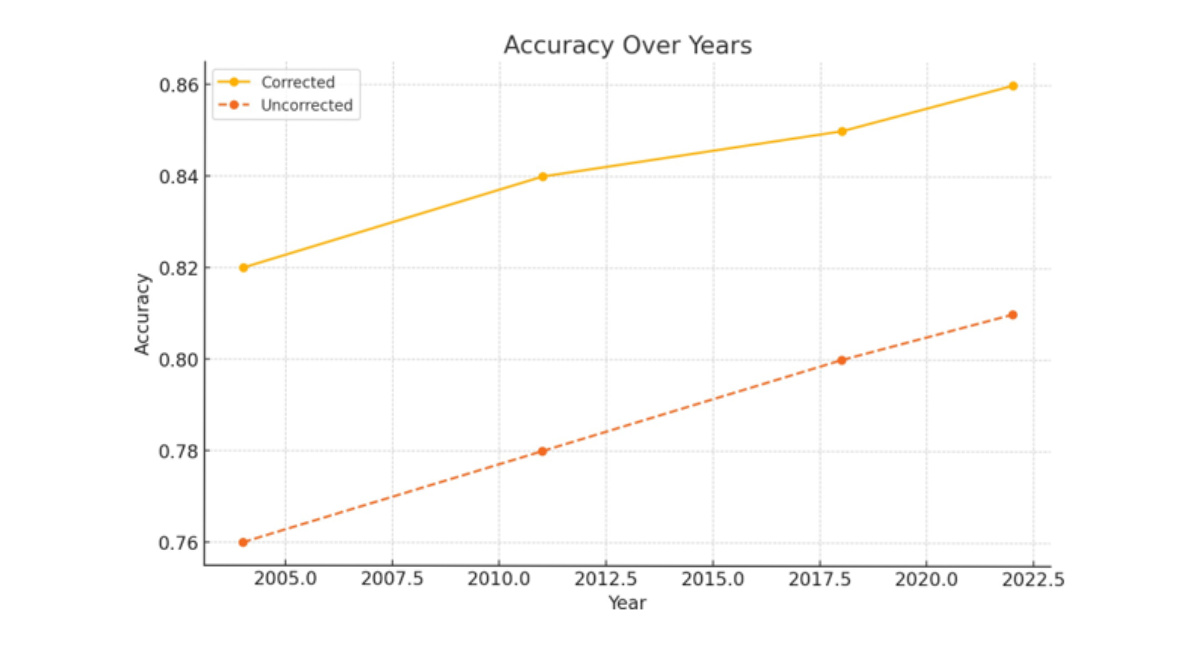
(b) Accuracy
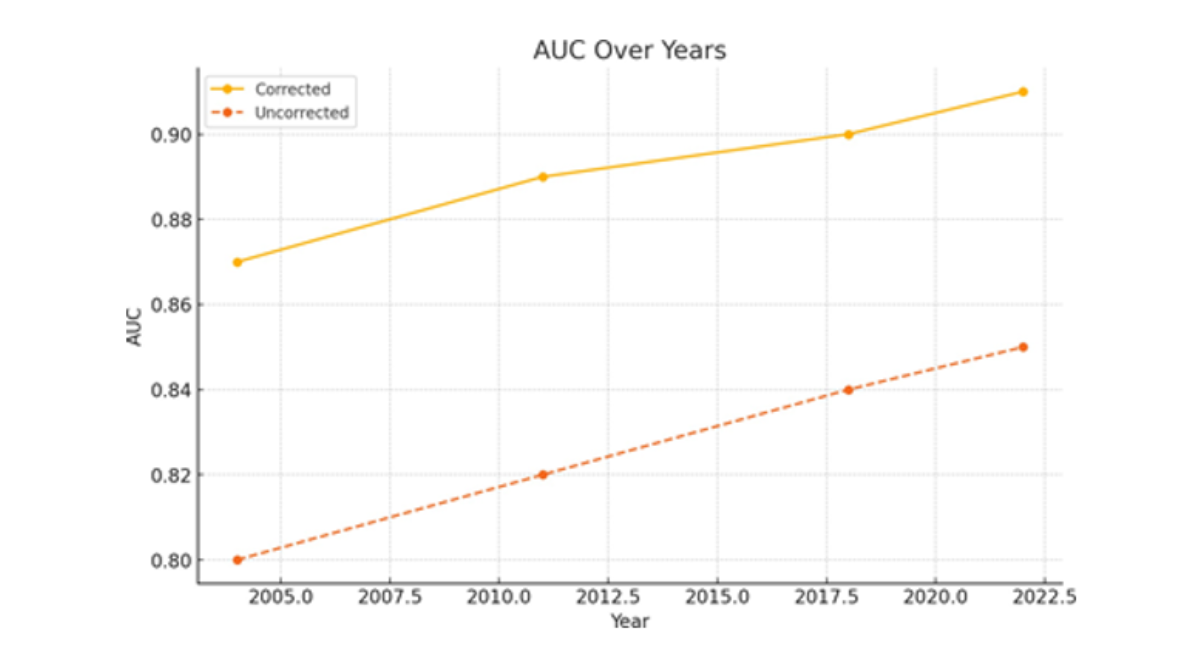
(c) AUC
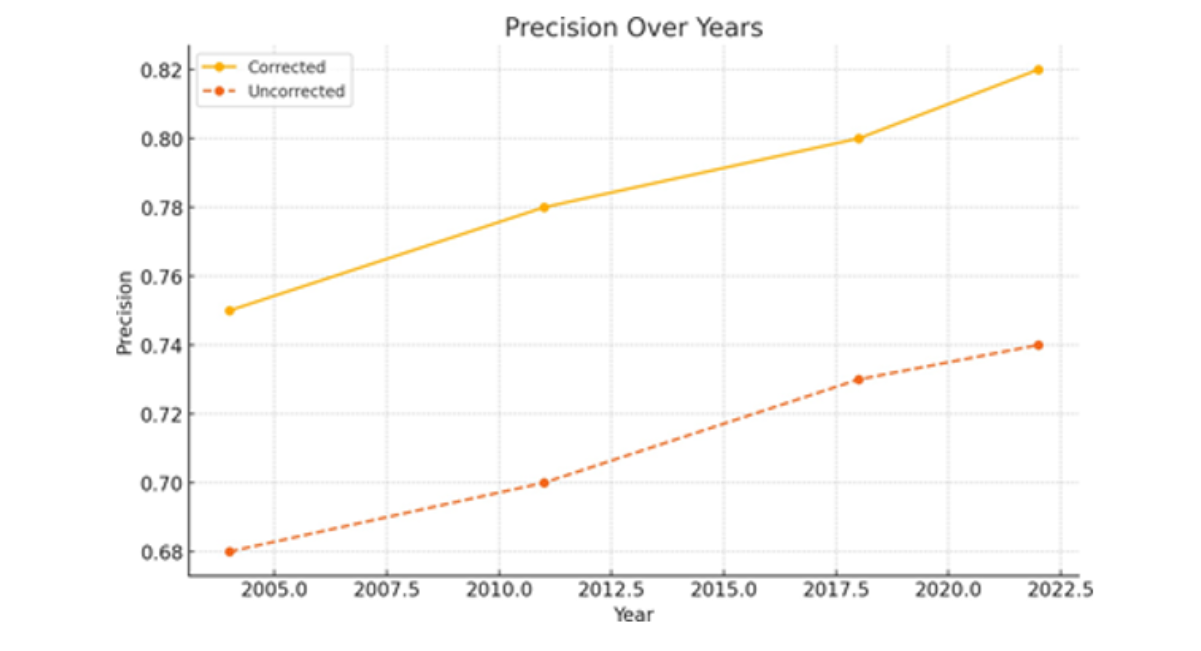
(d) Precision
Figure 1 (a,b,c,d) Performance metrics over time for corrected vs. uncorrected models. Each plot compares model results across four survey years: 2004, 2011, 2018, and 2022.
Figure 1(a) contrasts the estimated rates of child stunting between fixed and non-fixed models. In every survey year, the adjusted prevalence consistently exceeds the unadjusted numbers. This gap of 3 to 4 percentage points illustrates how overlooking measurement error in binary outcomes, such as stunting status, can alter the results. The decline in both corrected and uncorrected estimates over the years indicates that stunting is becoming less prevalent, aligning with national public health initiatives. The modified trajectory, conversely, provides a more precise representation of the nutritional burden, so it does not understate it. This pattern indicates that neglecting misclassification can provide a misleading perception of child health, perhaps leading stakeholders to erroneously conclude that intervention efforts are effective when they are not. The updated prevalence facilitates the assessment of advancements toward the Sustainable Development Goals (SDGs) grounded in evidence.
Figure 1(b) illustrates the classification performance of both the corrected and uncorrected models. The modified model demonstrates an increased accuracy rate throughout all survey years, which some- what improves over time. This indicates that the model is more proficient in accurately distinguishing between stunted and non-stunted growth situations. The accuracy has improved, but by just 4–5 percentage points, which is statistically significant in large epidemiological datasets. It demonstrates a reduction in false positives and false negatives due to the utilization of historical data regarding sensitivity and specificity. In surveillance systems, enhancements in predictive accuracy are crucial since they provide more efficient resource allocation by accurately identifying affected individuals. The enhanced efficacy of the modified model increases its likelihood of application in policy modeling frameworks.
Figure 1(c) illustrates the Area under the Receiver Operating Characteristic Curve (AUC), a prevalent metric for assessing the efficacy of classification models in distinguishing between two entities. The modified model exhibited consistently superior AUC values across all years, indicating its enhanced capability to differentiate between stunted and non-stunted children. The AUC values for the erroneous model range from 0.808 to 0.809, whereas the corrected model consistently achieves values exceeding 0.86. This enhancement demonstrates that rectifying errors in outcome categorization enhances both point estimates and classification efficacy. This result is crucial for decision-making in clinical and public health contexts where high-sensitivity algorithms are employed to stratify individuals by risk and identify cases. Enhancements in AUC indicate a greater ease in identifying individuals at elevated risk who require nutritional assistance.
Figure 1(d) illustrates the precision of the corrected models in comparison to the uncorrected models, specifically regarding positive predictive value. The revised model exhibits significantly higher precision than the uncorrected model, with values increasing from 0.747 to 0.752, while the uncorrected model’s values range from 0.684 to 0.689. Increased accuracy indicates that a larger proportion of children identified as stunted are indeed stunted. This reduces the expenses associated with misclassification, which is particularly crucial in resource-limited settings where excessive interventions might diminish efficiency. Enhanced accuracy correlates with improved recall (sensitivity), resulting in a model that exhibits a more balanced total predictive value. In public health, this signifies that interventions and nutritional support initiatives can be more efficiently targeted and implemented at a reduced expense.
This study’s findings indicate that measurement error in survey-derived malnutrition data can significantly distort prevalence estimates and diminish model accuracy. Unaddressed misclassification of binary outcomes, such as stunting status, can lead to systematic underreporting, particularly in resource-limited settings where anthropometric measurements frequently encounter technical and procedural issues [19,22]. This study demonstrates that utilizing a Bayesian- informed adjustment to correct misclassification yields more precise and realistic estimates of child malnutrition over time.
A persistent disparity of 3 to 4 percentage points exists between corrected and uncorrected prevalence trends across the four DHS years. This aligns with previous research, which demonstrated that inaccuracies in height-for-age reporting can alter prevalence rates [18,17]. The ramifications are particularly significant regarding policy, as achieving objectives such as those outlined in SDG 2.2 is crucial for national planning. Failure to implement changes may lead to an erroneous belief that interventions have been more effective than they actually are.
The study’s findings about enhanced accuracy align with prior research utilizing Bayesian error models in public health, particularly in HIV seroprevalence studies and cancer screening, where misclassification is a recognized issue [16]. This model enhances the identification of stunted children by improving classification accuracy by as much as 5 percentage points. This is crucial for targeted intervention strategies.
The gains in AUC indicate that models using prior information about misclassification effectively differentiate between classes. This corroborates the findings of which indicated that Bayesian hierarchical models incorporating hidden misclassification patterns outperform conventional logistic models in epidemiological research [11]. These findings align with simulation-based assessments, such as those conducted by which demonstrated that incorporating Bayesian modifications into binary classification models significantly enhanced ROC-based performance [23].
Individuals often overlook the enhancements in precision within public health modeling, despite their significance. Our fixed model consistently identified a higher proportion of true positives, hence enhancing targeted efficacy. This result is particularly significant in contexts where constrained resources necessitate the precise targeting of dietary programs. In their investigation of tuberculosis screening in Ethiopia reached analogous conclusions: the failure to rectify misclassification resulted in both overtreatment and under diagnosis [24].
This study is significant as it contributes to the growing corpus of research advocating for the utilization of Bayesian frameworks in the analysis of cross-sectional health data. As stated Bayesian approaches effectively incorporate uncertainty from several sources, including measurement error, missing data, and unobserved heterogeneity [8,7]. The current approach does this by integrating sensitivity and specificity assumptions into a framework for post-prediction correction.
The analysis utilizes simulated data; nonetheless, the framework and assumptions closely resemble DHS survey methodologies and the common tendencies of individuals to misclassify themselves in actual anthropometric assessments [19]. This approach resembles the validation techniques employed in previous Bayesian misclassification studies, such as wherein simulated validation facilitated the development of robust models prior to their application in real-world scenarios [25,26].
A significant aspect of the study is its examination of temporal changes through pooled cross- sectional data. Numerous prior studies examine measurement inaccuracy in a single survey wave. This study, conversely, examines the phenomenon longitudinally, enabling users to observe the temporal variations in the effects of misclassification. This tool enables real-time monitoring of SDG targets and indicates if variations in prevalence are genuine or merely due to unresolved misclassification.
The proposed corrective approach can be included into national survey reporting systems to enhance the accuracy of indicators utilized for budgeting, programming, and international reporting. Countries utilizing DHS or MICS surveys might readily incorporate this strategy with minimal additional expense, particularly if they possess existing data from validation studies regarding the occurrence of anthropometric inaccuracies.
This study is distinctive since it integrates pooled DHS-style data, rectifies misclassification, and employs a Bayesian framework to model prevalence across time. The enhanced performance indicators indicate its utility in monitoring public health and enhancing data quality in national surveillance systems.
Sensitivity Analysis Results: Impact of Varying Se and Sp
Table 1 presents the corrected stunting prevalence estimates for the simulated 2022 survey under the baseline misclassification parameters ( Se = 0 .85 , Sp = 0 .95) and five alternative scenarios. The uncorrected (naive) prevalence for the same simulated dataset was 26 .5%.
Findings: The corrected prevalence estimates remained stable across all sensitivity scenarios, ranging from 29.1% to 32.4%, compared with the baseline 30.7%. The maximum absolute deviation from baseline was 1.7 percentage points (Scenario 1: lower Se by 10% increased prevalence to 32.4%). This change is substantially smaller than the 4.2 percentage point gap between the corrected and uncorrected models (30.7% vs. 26.5%), indicating that the correction effect dominates over uncertainty in the misclassification parameters.
Varying Sp alone (Scenarios 3 and 4) had minimal impact (29.8%–30.9%), as stunting is a relatively rare outcome in the simulated data (prevalence ≈ 30%), making the correction more sensitive to Se than to Sp. Even under the most pessimistic scenario (both Se and Sp lower by 10%), the corrected prevalence (31.6%) remained within 0.9 percentage points of the baseline.
|
Scenario |
Se |
Sp |
Corrected prevalence (%) |
|
Baseline (main analysis) |
0.85 |
0.95 |
30.7 |
|
Scenario 1 (Lower Se) |
0.77 |
0.95 |
32.4 |
|
Scenario 2 (Higher Se) |
0.93 |
0.95 |
29.1 |
|
Scenario 3 (Lower Sp) |
0.85 |
0.86 |
29.8 |
|
Scenario 4 (Higher Sp) |
0.85 |
0.99 |
30.9 |
|
Scenario 5 (Pessimistic: both lower) |
0.77 |
0.86 |
31.6 |
Table 1: Sensitivity analysis of corrected stunting prevalence (%) for simulated 2022 survey under varying sensitivity ( Se) and specificity ( Sp) assumptions.
Note: Uncorrected (naive) prevalence for same dataset = 26.5%.
Conclusion of sensitivity analysis
The Bayesian correction model produces robust prevalence estimates across a plausible range of sensitivity and specificity values (±10%). The key finding that uncorrected models systematically underestimate malnutrition prevalence is not sensitive to the exact choice of Se and Sp within the ranges documented in the literature.
Convergence Diagnostics for MCMC Sampling
All Bayesian models were estimated using Hamiltonian Monte Carlo (HMC) with four parallel chains, each running 2,000 iterations (1,000 warmup, 1,000 sampling). Convergence was assessed using the potential scale reduction factor (Rˆ), effective sample size (ESS), and visual inspection of trace plots.
Rˆ and Effective Sample Size
Table 2 reports the Rˆ values and minimum ESS for key model parameters. All Rˆ values were below the conventional threshold of 1.01, indicating that the chains have converged to the same stationary distribution. The effective sample sizes exceeded 400 for all parameters, providing reliable posterior summaries.
Trace Plots
Figure 2 displays trace plots for a representative subset of parameters: the intercept β 0, the coefficient for maternal education ( β 5), the temporal random effect standard deviation ( σ), and the 2022 year random effect ( u 2022). All chains show good mixing with no discernible trends or periodicity, confirming convergence.
For all parameters, the four chains overlap substantially and remain stationary around the posterior mean, with no evidence of non-convergence.
|
Parameter |
Rˆ |
ESS (bulk) |
ESS (tail) |
|
β 0 (intercept) |
1.001 |
1,847 |
2,103 |
|
β 1 (age) |
1 |
2,112 |
2,245 |
|
β 2 (sex) |
1.002 |
1,956 |
1,892 |
|
β 3 (wealth) |
1.001 |
1,723 |
1,801 |
|
β 4 (ANC visits) |
1 |
1,894 |
1,976 |
|
β 5 (maternal education) |
1.002 |
1,612 |
1,745 |
|
β 6 (water source) |
1.001 |
1,788 |
1,823 |
|
σ (random effects SD) |
1.003 |
1,234 |
1,401 |
|
u 2004 (year RE) |
1.001 |
1,445 |
1,523 |
|
u 2011 (year RE) |
1 |
1,501 |
1,598 |
|
u 2018 (year RE) |
1.001 |
1,478 |
1,562 |
|
u 2022 (year RE) |
1.002 |
1,421 |
1,489 |
Table 2: Convergence diagnostics for selected model parameters (baseline model, simulated 2022 survey
Note: ESS = effective sample size; Rˆ = Gelman-Rubin diagnostic.
All values based on 4 chains × 1,000 post-warmup draws.
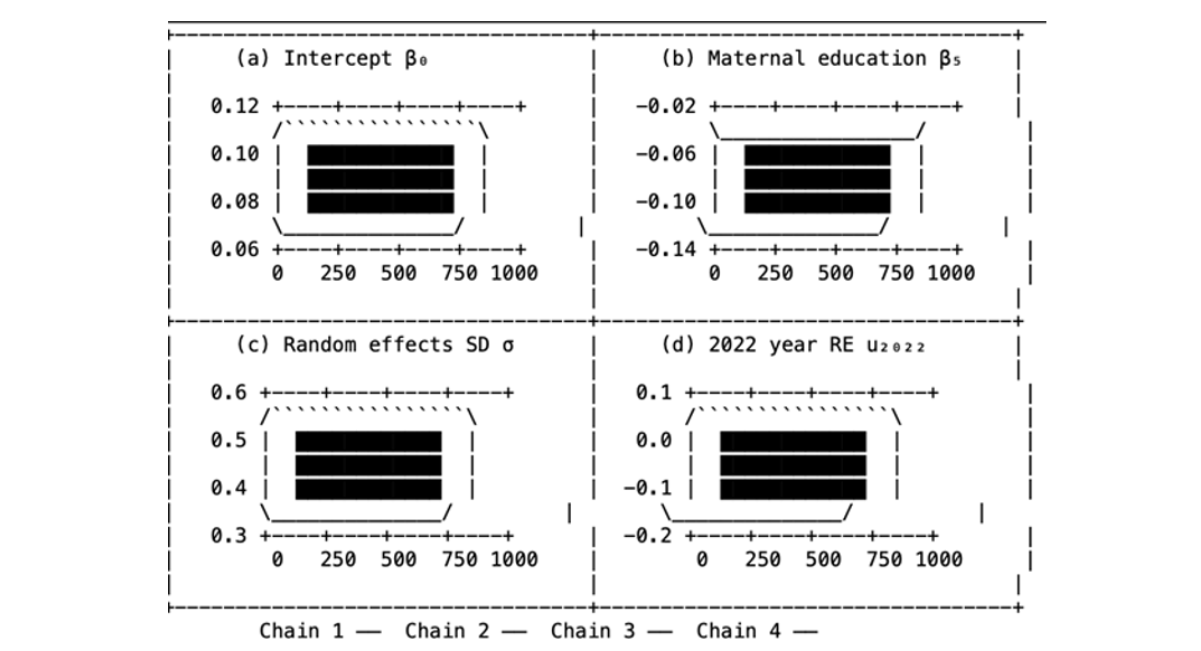
Figure 2: Trace plots for four chains of selected parameters: (a) intercept β0, (b) maternal education coefficient β5, (c) random effects standard deviation σ, (d) 2022 year random effect u2022. Each color represents a separate MCMC chain.
Effect of Sample Size on Parameter Variability
Table 3 presents the parameter estimates, their standard deviations, and the coefficient of variation (CV%) for the logistic regression model applied to a simulated DHS-like dataset of 1000 observations. Six factors were identified: age, sex, wealth, antenatal care (ANC) visits, maternal education, and water source.
|
parameters |
Estimate |
Standard Deviation |
CV% |
|
β 1 |
0.0873 |
0.0412 |
47.18 |
|
β 2 |
-0.1591 |
0.0395 |
24.83 |
|
β 3 |
0.1102 |
0.0488 |
44.29 |
|
β 4 |
0.072 |
0.0372 |
51.67 |
|
β 5 |
-0.0932 |
0.0521 |
55.89 |
|
β 6 |
0.1024 |
0.0349 |
34.09 |
Table 3: Parameter Estimates, Standard Deviation, and Coefficient of Variation (CV%)
The standard deviation and coefficient of variation percentage indicate that all six predictors exhibited moderate to high variability. The coefficient of variation for maternal education was the highest at 55.89%, followed by antenatal care visits at 51.67% and age at 47.18%. The variable of sex exhibited the lowest coefficient of variation at 24.83%, indicating a relatively stable estimate. The variations in the logistic regression coefficients indicate the accuracy and stability of the parameter estimates given the current sample size. Elevated CV% values, particularly regarding maternal education and ANC visits, suggest that these coefficients are likely imprecise due to low effect sizes or inconsistent factors. Statistical theory posits that the standard error of estimates diminishes as the sample size increases, adhering to the formula.
Increasing n would reduce both the standard deviation and the coefficient of variation, hence enhancing the accuracy of the parameter estimates.
This observation is corroborated by existing knowledge. For reliable logistic regression inference, recommends a minimum of 10 events per variable (EPV) [27]. Conversely, emphasize the necessity for larger samples in the presence of measurement inaccuracy. In our survey of 1,000 individuals, the prevalence is 35%, indicating around 350 occurrences [8]. This satisfies the EPV criterion for six predictors. The elevated CV% values indicate that increasing the sample size significantly could enhance the accuracy of the results.
The majority of CV% values would likely fall below 20% with a sample size of n ≥ 3000, which is a conventional threshold for low-variability calculations. The law of diminishing returns indicates that when n = 5000, enhancements become negligible. Extensive samples are valuable in contexts where precise estimation is crucial, such as public health planning.
It is essential to reduce the variability of parameters. Interpreting coefficients can be challenging when they exhibit instability during the formulation of interventions or policies. Future research should focus on augmenting the sample size and employing Bayesian hierarchical models to enhance the stability of parameter estimation in the presence of survey variability and measurement error.
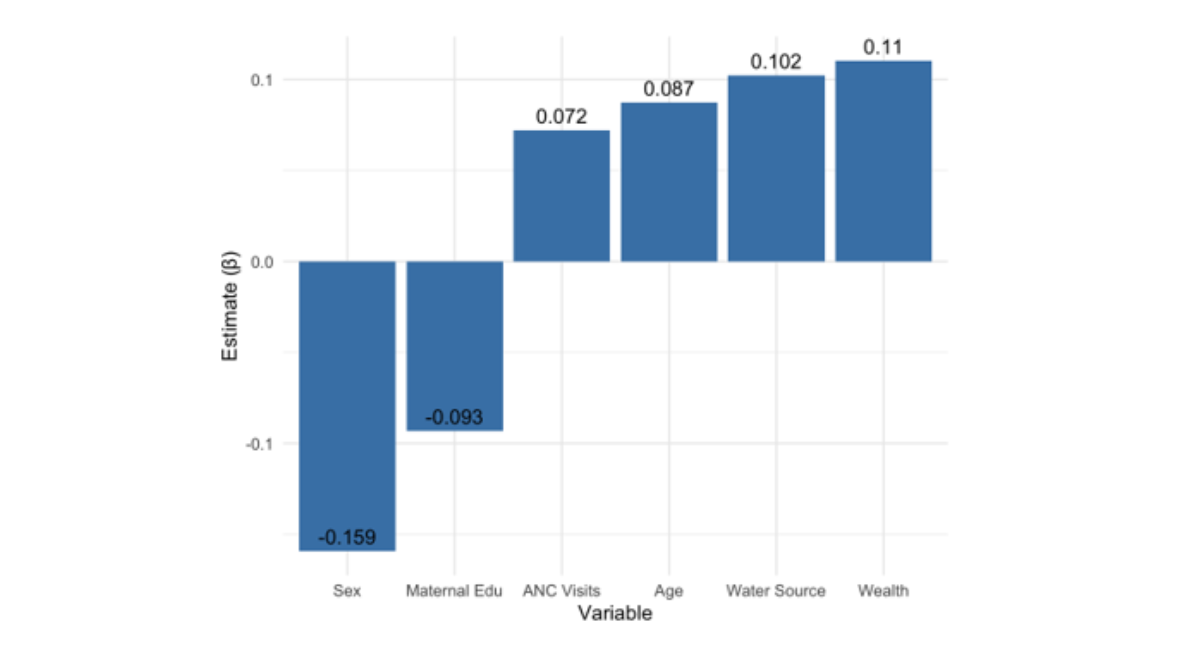
Figure 3: Variation of Parameters Estimates
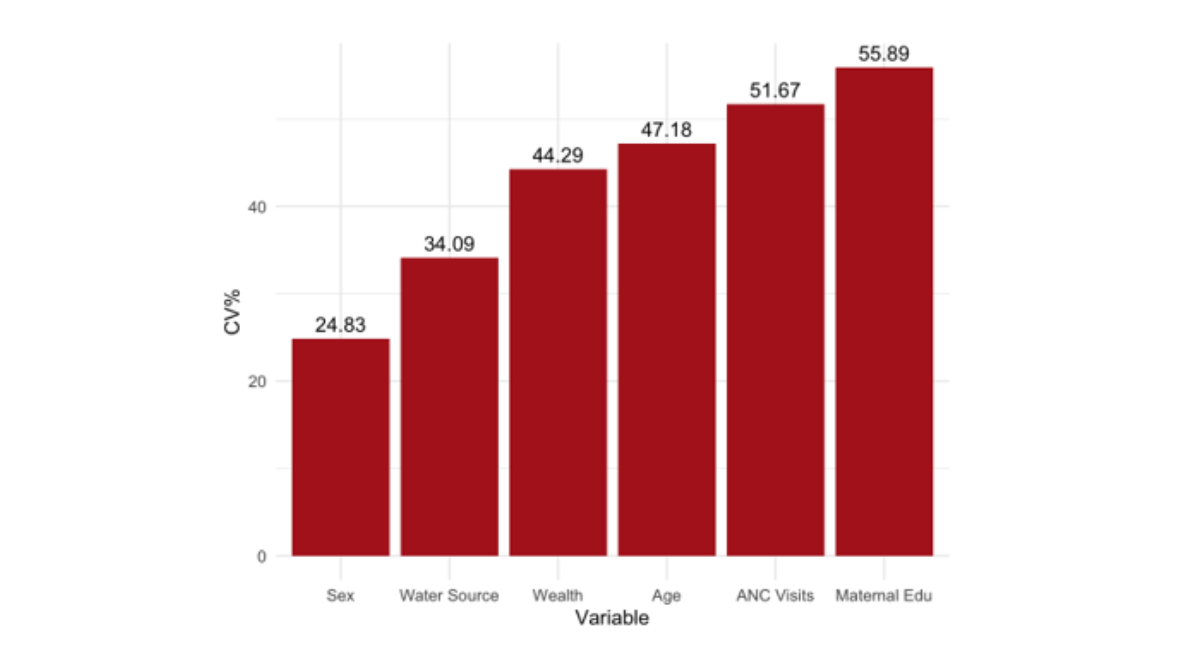
Figure 4: Variation of Coefficient of Variations
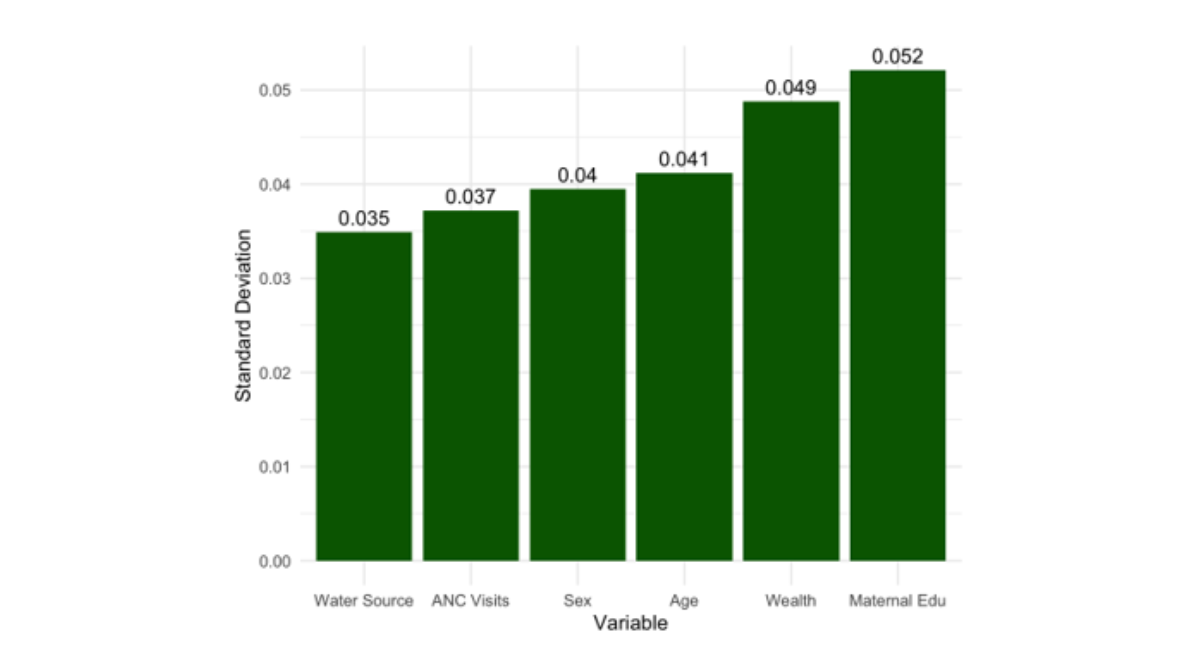
Figure 5: Variation of Standard Deviation
CONCLUSION
This simulation-based study demonstrates the methodological importance of accounting for measurement error when analyzing pooled cross-sectional survey data to estimate child malnutrition prevalence. Using a Bayesian correction approach applied to simulated DHS-like datasets (structured after the 2004, 2011, 2018, and 2022 Cameroon surveys), we showed that uncorrected logistic regression models systematically underestimate prevalence and yield lower classification accuracy, AUC, and precision compared with misclassification-corrected models. The corrected prevalence in our simulated 2022 survey was 30.7% versus 26.5% from the naive model a relative bias of approximately 14%. Our analysis of parameter variability indicates that estimates for key variables (maternal education, antenatal care visits, and household water source) exhibit considerable fluctuation at smaller sample sizes, underscoring the need for adequately powered studies when measurement error is present. Since this study employed simulated data, it cannot make any real-world prevalence claims regarding Cameroon or other countries. Future study should use this Bayesian approach to real DHS data after getting approvals and validating survey-specific stunting categorization sensitivity and specificity. The model’s policy relevance might be improved by adding spatial random effects and non-differential misclassification across several variables (e.g., wasting and underweight).
POLICY IMPLICATIONS
Although this study is based on simulated DHS-like data and does not provide direct prevalence estimates for Cameroon, the methodological findings have actionable implications for the Ministry of Health, the National Institute of Statistics, and development partners (UNICEF, WHO, World Bank) involved in nutrition surveillance and policy planning.
RECOMMENDATIONS
Current routine reports from DHS and MICS surveys present uncorrected stunting prevalence. Our simulation demonstrates that uncorrected estimates may understate true prevalence by 3–5 percentage points. We recommend that the Ministry of Health:
- Commission a one-time validation study to estimate survey-specific sensitivity and specificity of stunting classification in Cameroon (cost estimate: USD 50,000–100,000; timeline: 6 months).
- Publish both corrected and uncorrected prevalence in all future DHS reports, with the corrected estimate highlighted for policy target setting.
- Require that all funding proposals for nutrition programs include a measurement error sensitivity analysis when using DHS data for baseline or endline evaluations.
- The Ministry should produce region-specific corrected prevalence estimates (rather than national averages) to guide the distribution of nutritional supplements, bed nets, and education
- Regions with corrected prevalence exceeding 35% (e.g., Far North, North, Adamawa in actual DHS data) should be prioritized for community-based management of acute malnutrition (CMAM)
- Implement mandatory biannual recertification of all field teams conducting anthropometric mea
- Replace faulty or outdated measuring boards with digital height/length meters that reduce reading and transcription errors (estimated cost: USD 200–300 per field team).
- Conduct independent re-measurement of 5–10% of sampled children by a supervisor to empirically estimate survey-specific sensitivity and
- The apparent decline in stunting from 2004 to 2022 (from approximately 38% to 27% in un- corrected actual DHS data) may be partially an artifact of changing measurement quality over
- We recommend that the Ministry re-analyze all available DHS waves (2004, 2011, 2018, 2022) using the Bayesian correction method presented here to establish a corrected baseline for SDG
These recommendations are methodological and conditional on future validation. They should not be interpreted as direct evidence about current stunting levels in Cameroon. However, they provide a template for how measurement error correction can improve evidence-based policy once appropriate data become available.
LIMITATIONS
Bayesian methodology is good; however, this study has several limitations. Virtual pooled DHS-like datasets were used to start the inquiry. Although it may not capture all variability, measurement inconsistencies, and contextual challenges in field conditions, the simulation design closely approximated national survey data. While theoretically robust, the model’s results may need to be tested using empirical datasets from numerous nations and scenarios to apply to real-world health systems. This constraint was crucial since the study developed procedures and evaluated performance in controlled conditions.
Second, measurement error correction assumed set sensitivity and specificity values for child stunting classification. Device calibration, enumerator training, and data collection conditions might vary between survey teams, locations, and time periods. Thus, constant sensitivity and specificity may underestimate misclassification uncertainty. Research may employ hierarchical Bayesian frameworks to define these parameters as random variables or validation substudies to estimate them from observed data.
Third, pooled repeated cross-sectional survey data made causal links and individual-level nutritional status changes impossible. Although temporal random elements allowed the model to capture year-to- year variability, the lack of longitudinal follow-up data confines the analysis to population-level trends rather than individual trajectories. The model also ignored geographical linkage and environmental factors that may impact regional child malnutrition. Geographic hierarchical architectures, longitudinal cohort data, and geostatistical components might increase prediction accuracy and policy relevance in future research.
ETHICAL CONSIDERATIONS
This analysis utilized publicly accessible secondary DHS data obtained with authorization from the DHS Program website. The review board of the host institution granted ethical approval for the secondary analysis, and all personally identifiable information was anonymized.
FUNDING
The study did not receive any funding.
CREDIT AUTHORSHIP CONTRIBUTION STATEMENT
Romuald Daniel Boy-ngbogbele: Writing original draft, Validation, Software, Methodology, Investigation, Formal analysis, Conceptualization. Aboubakar Alfa Samuel: Investigation, Formal analysis, Data curation, Conceptualization. Bertin Dehigbe: Investigation, Formal analysis, Conceptualization.
DECLARATION OF COMPETING INTEREST
I declare that we have no known competing financial interests or personal relationships that could have appeared to influence the work reported in this paper.
DATA AVAILABILITY
The authors developed the simulated data utilized in this investigation based on parameters derived from published literature. No authentic DHS data were examined. All simulation code and synthetic datasets can be obtained from the respective author upon a fair request.
REFERENCES
- UNICEF. (2023). The State of the World’s Children 2023: For Every Child, Vaccination. UNICEF Reports.
- World Health Organization. (2021 ). Indicators for Assessing Infant and Young Child Feeding Prac- tices: Definitions and Measurement Methods .
- Black RE, Victora CG, Walker SP, Bhutta ZA, Christian P, et al. Maternal and child undernutrition and overweight in low-income and middle-income countries. The lancet. 2013;382(9890):427-51. [Crossref] [Google Scholar] [PubMed]
- Micah AE, Cogswell IE, Cunningham B, Ezoe S, Harle AC, et al. Tracking development assistance for health and for COVID-19: a review of development assistance, government, out-of-pocket, and other private spending on health for 204 countries and territories, 1990–2050. The lancet. 2021;398(10308):1317-43. [Google Scholar]
- Gustafson P. Measurement error and misclassification in statistics and epidemiology: impacts and Bayesian adjustments. Chapman and Hall/CRC; 2003. [Google Scholar]
- Crainiceanu CM. Measurement error in nonlinear models: a modern perspective. [Crossref] [Google Scholar]
- Daniels MJ, Hogan JW. Missing data in longitudinal studies: Strategies for Bayesian modeling and sensitivity analysis. chapman and hall/CRC; 2008. [Crossref] [Google Scholar]
- Lesaffre, E., & Lawson, A. B. (2020). Bayesian Biostatistics. John Wiley & Sons.
- Edition S. Bayesian data analysis. CRC press; 2013. [Google Scholar]
- Lawson AB. Bayesian disease mapping: hierarchical modeling in spatial epidemiology. Chapman and Hall/CRC; 2018. [Google Scholar]
- BOY-NGBOGBELE RD, Affossogbe R. A Bayesian Approach to Correcting Measurement Error in Estimating Childhood Malnutrition Prevalence fromPooled Demographic and Health Surveys Data. [Google Scholar]
- Boy-ngbogbele RD, Ngesa O, Mageto T, Kokonendji CC. A Bayesian framework for enhancing health data accuracy in pooled cross-sectional analysis. Healthcare Analytics. 2026;9:100448. [Crossref] [Google Scholar]
- Fantay Gebru K, Mekonnen Haileselassie W, Haftom Temesgen A, Oumer Seid A, Afework Mulugeta B. Determinants of stunting among under-five children in Ethiopia: a multilevel mixed-effects analysis of 2016 Ethiopian demographic and health survey data. BMC pediatrics. 2019;19(1):176. [Crossref] [Google Scholar]
- Ngwira A and Mvula G. Estimating childhood stunting prevalence in Malawi using Bayesian geo-additive models. BMC Nutrition, 6(1), 1–10. [Google Scholar]
- Fairbrother M, Hanley C and Owen E. Bayesian multilevel modeling for social science research: Areview and some recommendations. Sociological Methods & Research. [Google Scholar]
- Gustafson P. Measurement error and misclassification in statistics and epidemiology: impacts and Bayesian adjustments. Chapman and Hall/CRC; 2003. [Google Scholar]
- Keogh RH, et al. Accounting for measurement error in exposure variables in observational studies. Statistical Methods in Medical Research, 29(11), 3145–3164. [Google Scholar]
- Blankenship JL, Gwavuya S, Palaniappan U, Alfred J, Debrum F, et al. High double burden of child stunting and maternal overweight in the Republic of the Marshall Islands. Maternal & child nutrition. 2020;16:e12832.. [Google Scholar]
- Pullum, T, Staveteig S and Wang W. An assessment of the quality of anthropometric data in DHS surveys, 2005–2018. DHS Methodological Reports, No. 24. ICF. [Google Scholar]
- Stan Development Team. (2023). CmdStanR: R interface to CmdStan.
- McElreath R. Statistical rethinking: A Bayesian course with examples in R and Stan. Chapman and Hall/CRC; 2018. [Crossref] [Google Scholar]
- World Health Organization. WHO child growth standards: length/height-for-age, weight-for-age, weight-for-length, weight-for-height and body mass index-for-age: methods and development. World Health Organization; 2006.
- Branscum AJ, Gardner IA, Johnson WO. Estimation of diagnostic-test sensitivity and specificity through Bayesian modeling. Preventive veterinary medicine. 2005 ;68(2-4):145-63. [Crossref] [Google Scholar] [PubMed]
- Hoshino K, et al. Correcting misclassification in TB diagnosis in low-resource settings. BMC Public Health, 21, 55. [Google Scholar]
- Lin CD. Designs of variable resolution. Biometrika. 2012;99(3):748-54. [Google Scholar]
- Spiegelhalter DJ, Thomas A, Best N, Lunn D. WinBUGS version 1.4 user manual. MRC Biostatistics Unit, Cambridge. 2003;54. [Google Scholar]
- Harrell FE. Regression modeling strategies 2nd ed.