


ABSTRACT
Introduction: Human migration significantly impacts social and economic systems, yet traditional forecasting models struggle to capture its complex, high-frequency dynamics. Advances in machine learning offer improved predictive capabilities, but most models remain static and limited in temporal and spatial integration. This study proposes a hybrid CNN-LSTM framework to predict migration flows by combining spatial and temporal feature extraction and integrating multi-source data for real- time prediction.
Methods: Using 114,612 records from the Dabat Health and Demographic Surveillance System (2008–2021), data were preprocessed, normalize, and dimension were analyzed using PCA analysis. Key predictors were identified via feature importance score analysis. A hybrid 1D CNN-LSTM model was trained using the Adam optimizer and performance was assessed with accuracy, precision, recall, F1 score, ROC-AUC, and confusion matrices.
Results: The model achieved a training accuracy of 0.9960, while both validation and test accuracies were approximately 0.9898, indicating consistently high performance. Precision, recall, and F1-scores followed a similar trend, with validation and test scores of 0.9897 and 0.9898, respectively, and minimal misclassification. Feature analysis identified End_type, Reason_for_migration, and Start_type as the dominant predictors. The dashboard effectively visualized migration trends, including in- and out-migrant counts, demographic distributions, and real-time hotspots. The result demonstrates that the robustness and reliability of the hybrid CNN-LSTM approach for migration prediction.
Conclusion: The hybrid CNN-LSTM approach delivers highly accurate, real-time migration forecasts and identifies key determinants. By combining spatial-temporal modeling with interactive visualization, the system supports data-driven decision-making and scalable migration monitoring in resource-limited contexts.
Keywords: Human Migration; Migration Prediction; Spatiotemporal Modeling; Machine Learning; Real- Time Monitoring; Multi-source Data
INTRODUCTION
Human migration, defined as the movement of people from one location to another, either temporarily or permanently has been a consistent driver of social and economic change throughout history [1]. This multifaceted phenomenon includes internal, international, seasonal and permanent migration [2]. While migration can be voluntary, motivated by economic prospects, education, or family reunification it is often forced by war, political instability, or environmental crises [1,3]. In recent decades, migration has been reshaped by a combination of geopolitical conflict, climate change, and urbanization. Ongoing global crises, such as civil wars and natural disasters, have significantly increased displacement and refugee movements [4]. Environmental triggers, particularly climate-induced events like droughts, floods, and rising sea levels, now drive a growing share of global migration. These factors more affect developing nations [1]. Migrants also play key roles in labor markets by filling skill gaps and sending remittances, although such flows can lead to "brain drain" in origin countries [5]. The global scale of migration is notable: The United Nations reported 281 million international migrants in 2020, accounting for 3.5% of the global population, representing a significant rise from 2.8% in 2000 and 2.3% in 1980. By 2022, the UNHCR counted over 35 million refugees, including 5.9 million Palestinians and 5.4 million asylum seekers [6]. Africa reflects a distinct migration pattern. Migration within the continent has risen steadily, reaching over 40 million by 2023, a 30% increase since 2010. Contrary to popular belief, 80% of African migrants remain within Africa, with regional economic hubs like South Africa, Côte d’Ivoire, and Nigeria being top destinations [7]. Traditional migration forecasting methods, such as gravity or radiation models, often fall short in capturing the complexity and dynamism of modern migration flows. They typically depend on outdated census or administrative data and lack real-time responsiveness, limiting their use during sudden crises or fast-changing contexts [2]. Furthermore, these methods struggle to incorporate high-frequency data sources such as satellite imagery, mobile signals, and social media, which now provide granular, near-real-time indicators of population movement. As a result, policymakers face challenges in responding quickly to emerging migration hotspots or tailoring interventions to evolving conditions [8]. To address these shortcomings, recent studies have explored machine learning (ML) as a promising alternative for migration modeling. ML approaches have demonstrated superior performance in predicting migration flows by learning complex patterns from large, multi-source datasets without being explicitly programmed [9,10].
For instance, Robinson and Dilkina introduced a regression-based ML model using extreme gradient Boost (XGBoost) and neural networks to predict origin destination flows more accurately than classical models. However, their approach lacked temporal dynamics and relied on simplistic data balancing [11]. Further advancements include Anakal et al., who evaluated European migration forecasting tools but noted their limited validation, lack of methods, and immature interfaces [12]. Bangole et al. applied ML classifiers to predict net migration but were constrained by binary classifications and lack of temporal context [13]. Others proposed combining geopolitical and climate data using supervised and unsupervised learning, yet these efforts often lacked real-time monitoring, streaming pipelines, and ethical oversight [14]. Despite promising results, most models remain static, offline, and narrowly focused, missing the opportunity for real-time, actionable insights that could guide policy and humanitarian responses. While machine learning has enhanced the accuracy of migration forecasting, key limitations remain. Current models are predominantly offline, rely on pre- aggregated data, and often ignore temporal sequences critical for understanding migration dynamics. Early models failed to capture time dependencies, and newer operational tools lack transparency, robustness, and real-time integration [11,12].
At the same time, a surge in diverse migration related data ranging from satellite and IoT sensors to social media and conflict reports presents an opportunity for more responsive forecasting. However, existing systems do not capitalize on these resources due to architectural rigidity, lack of automation, and insufficient interface development [8,14]. Thus, there is a pressing need for an adaptive, data- driven platform that integrates heterogeneous, high velocity data streams and updates its forecasts dynamically. Such a system could support decision makers through intuitive dashboards, early-warning alerts, and real-time migration monitoring. A significant research gap lies in the lack of a unified deep learning model that fuses spatial and temporal dynamics for migration prediction. Specifically, not existing system effectively integrates: temporal learning, spatial feature extraction. real-time, multi- modal data ingestion, and interactive, policy-oriented dashboards for actionable insights.
Bridging this gap would enable responsive, fine grained forecasting of migration flows and align predictive modeling with operational needs. This study proposes a hybrid deep learning framework that combines LSTM and CNN architectures to capture both temporal sequences and spatial characteristics of migration data. The model will ingest multi-source data, including socio-economic, environmental, and geopolitical indicators, to produce dynamic forecasts. These predictions will be visualized through an interactive platform for real-time migration monitoring and policy support.
MATERIALS AND METHODS
System Architecture
The architecture of the proposed system, as illustrated in Figure 1, consists of key modules arranged in a sequential pipeline: First, raw data is acquired and then preprocessed through cleaning, normalization, dimensionality reduction, and feature evaluation. A hybrid CNN-LSTM model is then developed, featuring a 1D convolutional layer with 64 filters, a batch normalization layer, and a 128- unit LSTM layer. The model also includes a dropout layer (rate 0.3), a dense hidden layer (64 neurons, ReLU activation), and a final output dense layer. It's compiled with the Adam optimizer and uses categorical cross-entropy loss. After development, the model is trained, validated, and finally deployed and monitored.
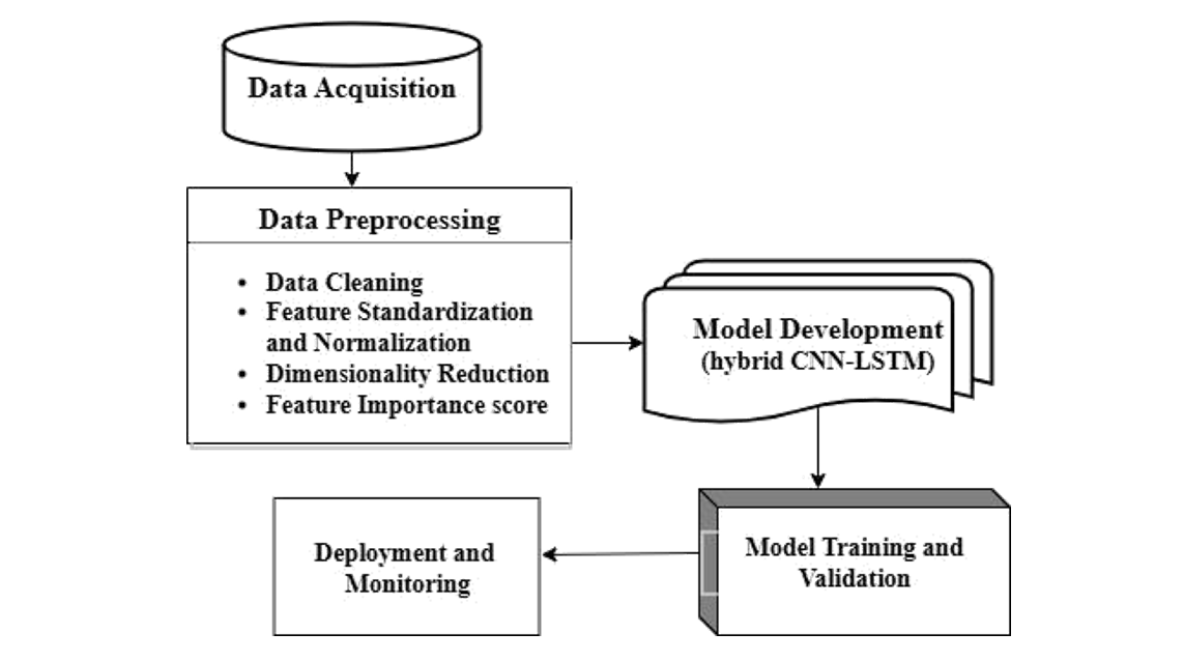
Figure 1: Architecture of the study design
Study area
The study was conducted in Dabat District, located in the North Gondar Zone of the Amhara Region, Ethiopia, as shown Figure 2. The district encompasses three ecological zones: Dega (highland and cold), Woyna-Dega (midland and temperate), and Kolla (lowland and hot). Data were collected from 13 purposively selected kebeles.
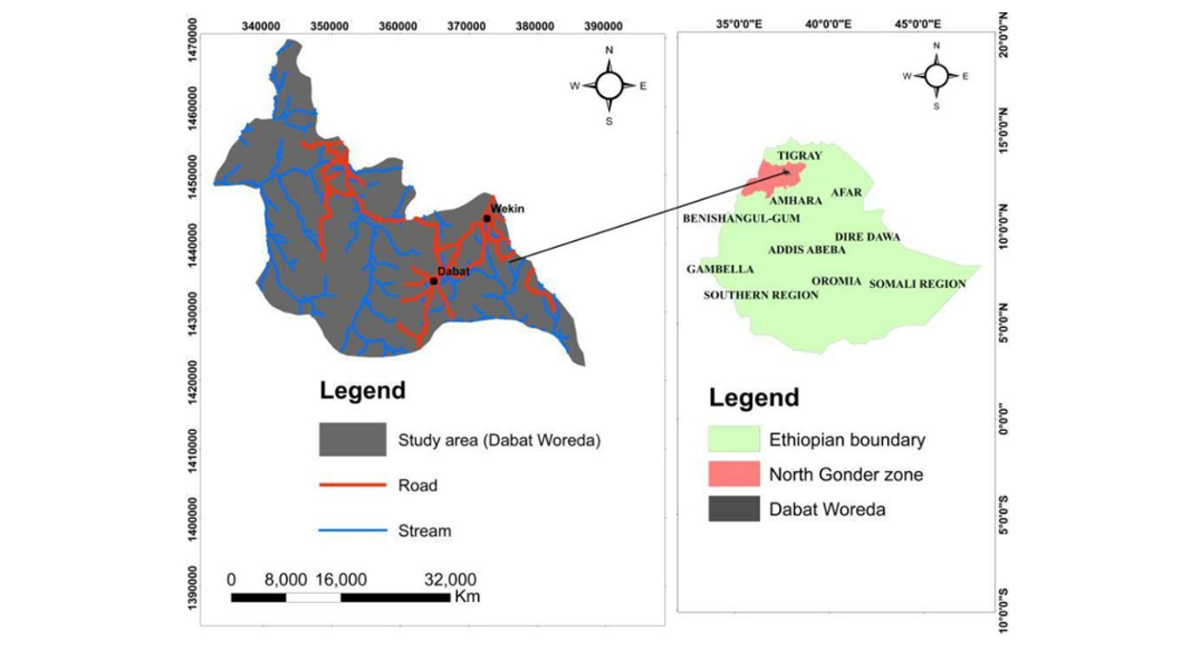
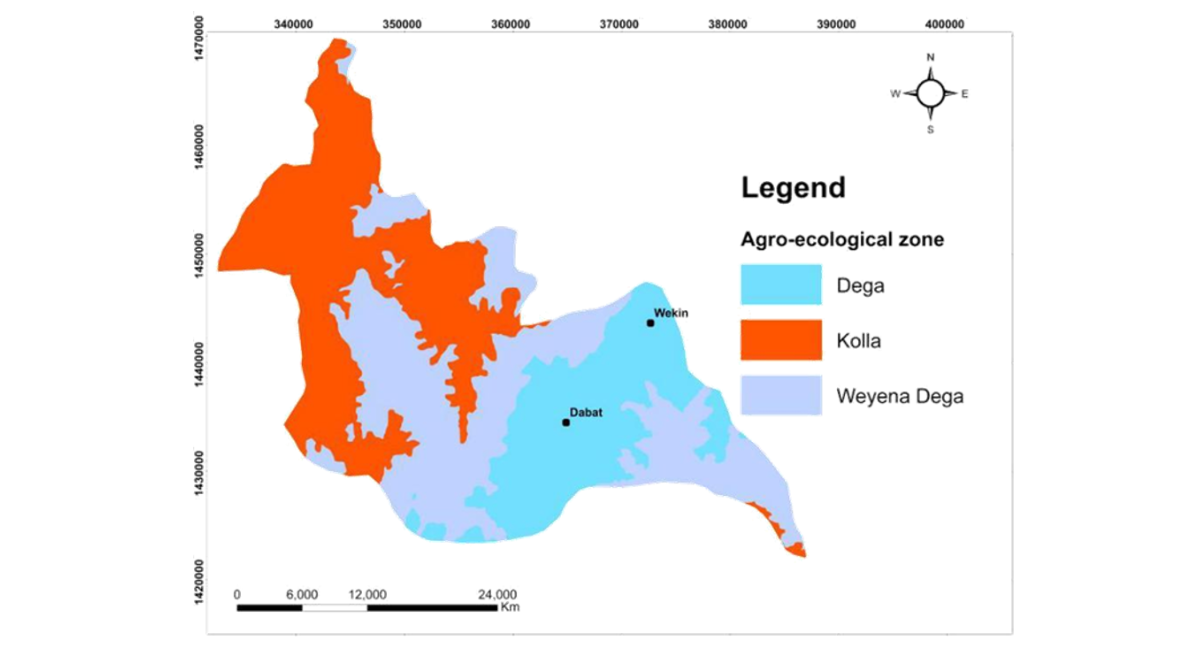
Figure 2: The study area location map, developed in ArcGIS, provides detailed visualization of the road network, ecological zones, and stream channels within the region
Data set
The dataset for the study was sourced from the Dabat Health and Demographic Surveillance System (DHDSS), administered by the University of Gondar Specialized Hospital. Established in 1996 by the former Gondar College of Medical Sciences(https://drc.uog.edu.et/), the DHDSS operates under the Dabat Research Center (DRC). Data were collected between 2008 and 2021 and were coordinated by a central office at the University of Gondar and a sub-office in Dabat Town. The data collection team comprised one lead data manager, one assistant, eight supervisors, and approximately 40 field workers. Data collection tools included paper-based questionnaires, GPS devices, and mobile tablets equipped with the OPENHDS application for data entry and ODK Aggregate for server transmission. The final dataset contains 133,731 records, covering variables such as Age, Edu_Category, Loc_Type, Marital Status, End Type, Gender, Occupation, Religion, Start Type, Altitude, Latitude, Longitude, Reg_Year, and Reason. In the DHDSS context, Start_type and End_type, which describe demographic events. Start_type: This variable indicates the event through which an individual becomes part of the surveillance population. The categories include values:
- Enumeration: Individuals who were already residing in the surveillance area when the system began and were recorded during the baseline census.
- Birth: Individuals born within the surveillance area during the study period.
- In_migration: Individuals who moved into the surveillance area from another location and became residents.
End type: This variable indicates the event through which an individual exits observation in the surveillance system or remains under follow-up. The categories include values:
- Active population: Individuals who continue to live in the surveillance area and remain under observation.
- Out-migration: Individuals who moved out of the surveillance area to another location.
- Death: Individuals who died while being part of the surveillance population.
Data Preprocessing
Data preprocessing is crucial for accurate analysis [15]. and is essential for ensuring high-quality inputs and reliable machine learning outcomes. It involves cleaning data to remove duplicates and errors [16], imputing missing values using methods such as mean, median, or random-sample substitution [17]. detecting and removing outliers via Z-score thresholds [18]. scaling features through normalization or standardization (Z-score) [19], and reducing dimensionality with feature selection techniques or projection techniques like PCA [20]. Below, we briefly discuss critical data preprocessing techniques essential for data analysis.
Data cleaning
All missing numeric values were imputed with their respective column means. The target variable represents migration status which indicate whether an individual expected to out-migrate or remain with population during the observation period. And the target variable was encoded as, no migration labeled as 0 and out-migration labeled as 1 was encoded using label encoding. Also, the categorical variables like Gender, Education_level, Marital_status, Occupation, Religion, Start_type, and Reason_for_migration were encoded using one-hot encoding via pd.get_dummies (). For Variables like End_type potentially encode events related to migration outcomes (e.g., out-migration or death). To prevent leakage, the target migration label was constructed independently and predictor variables were evaluated for their temporal relationship with the outcome. All preprocessing techniques, including feature standardization and dimensionality reduction, were applied to the training data and subsequently applied to validation and test sets, ensuring that no information from the test data influenced model training. To guard against extreme values, we computed Z-scores for each observation and set a dynamic cutoff at the 99th percentile. An Isolation Forest was then used to flag any samples whose Z-scores exceeded this threshold as outliers. These anomalies were removed, yielding a final, cleaned dataset of 133,731 records.
Feature Standardization and normalization
To ensure that all features contribute equally to the model and improve convergence, feature standardization is applied. This process transforms the data such that each feature has a mean of zero and a variance of one. Using the StandardScaler from the preprocessing library, the features are scaled by fitting the scaler to the data and then transforming it accordingly.
Dimensionality Reduction
To minimize feature dimension and drop redundancy among correlated variables, PCA was applied. All numerical features were standardized using StandardScaler, ensuring zero mean and unit variance. PCA was then performed to transform the feature space into orthogonal components ranked by explained variance. The Components were retained based on a cumulative explained variance threshold of 99%, resulting in N principal components that preserved the majority of the information contained in the original dataset while reducing model complexity and computational cost.
To identify of the most influential predictors contributing to migration prediction a Random Forest Classifier was trained using RandomForestClassifier(random_state=42). Feature importance scores were then extracted to identify the most influential variables. The results (Figure 3), visualized in a bar chart, reveal that End_type is by far the most significant feature with a score of 0.63.
Model Training and Validation
Deep learning, a major advancement in machine learning, enables powerful solutions for complex data tasks. One-dimensional convolutional neural networks (1D-CNNs) are efficient for processing 1D data due to their lower computational cost compared to 2D-CNNs. They use convolutional, pooling, activation, and dropout layers to extract features and classify data effectively. hyperparameters include the number of layers, filter size, and stride. ReLU activation helps address vanishing gradients [21]. Additionally, long short-term memory networks (LSTMs), a type of recurrent neural network (RNN), use gates (input, forget, output) to retain relevant long-term information and are widely used for sequence prediction and classification [22]. The proposed model architecture integrates a hybrid CNN-LSTM structure designed to extract both spatial and temporal features from sequential data. To capture temporal dynamics in migration patterns, the dataset was transformed into sequential samples using a sliding window approach. Each input sequence consists of a fixed number of consecutive observations defined by a window_size parameter. The input shape is defined as (window_size, n_features). The architecture starts with a 1D Convolutional layer extracts local feature interactions with 64 filters and a kernel size of 3 using ReLU activation and same padding, followed by Batch Normalization to stabilize training. This is then passed to a LSTM layer with 128 units to captures temporal dependencies across sequential migration records, enabling the model to learn both spatial relationships and temporal migration dynamics, followed by a Dropout layer with a rate of 0.3 to reduce overfitting and fully connected Dense layer with 64 units and ReLU activation function. The model is compiled using the Adam optimizer, with categorical cross-entropy as the loss function and accuracy as the performance metric.
Experiment setup
The dataset was divided into training, validation, and test sets using a stratified sampling strategy to maintain class distribution across subsets. The data was first split as: 80:20 train test split, out of 80% training where split to 80% for training and 20% for validation set. To ensure robustness and reproducibility, 3-fold cross-validation was applied during model training. Each fold was used once as validation while the remaining folds were used for training. Model training was performed using the hyperparameters adjustment as max epoch 100%, batch size 32, LR 0.001, Adam optimizer and dropout rate of 0.3. All experiments were implemented using Python with TensorFlow/Keras libraries, and a fixed random seed (random_state = 42) was used to ensure reproducibility.
Performance Metrics
The performance assessment metrics for a model for predicting immigration, both inbound and outbound, can vary depending on the specific goals of the research. The following are some commonly used metrics [23,24].
- Accuracy: Measures the overall correctness of the model, calculated as the ratio of correctly predicted instances to total instances.
- Precision: Focuses on the accuracy of positive predictions, calculated as the ratio of correctly predicted positive observations to the total predicted positives.
- Recall: Evaluates the model's ability to capture all relevant positive instances, calculated as the ratio of correctly predicted positives to all actual positives.
- F1 Score: Provides a balance between precision and recall, calculated as the harmonic mean of both metrics.
- Confusion Matrix: Offers a detailed performance breakdown, showing the counts of true positives, true negatives, false positives, and false negatives.
- AUC-ROC Curve: Useful for binary classification, it plots the true positive rate against the false positive rate at various thresholds to assess model performance. These metrics, when combined, provide a comprehensive view of the model’s effectiveness in predicting immigration patterns [23,24]. The formulas are given by:
where:
TP = True Positives, TN = True Negatives, FP= False Positives, FN= False Negatives
Deployment and Monitoring
The trained model has been seamlessly integrated into a web-based application equipped with an intuitive graphical user interface, a robust backend database, and a dynamic reporting dashboard. The system continuously processes real-time migration data, performing preprocessing and feature extraction. Threshold-based triggers are employed to detect surges in predicted migration flows. Users can explore migration through interactive hotspot detection, analyze temporal and spatial patterns using time-series and distribution charts, and examine a dynamically ranked list of the top determinant factors influencing migration. Key analytical visualization insights is exemplified in Figure 10. And the full application project is found at (https://github.com/Beke1e/migration)
RESULTS
Metadata and Descriptive Statistics
The original dataset contains 114,612 records. After applying SMOTE the dataset increased to 133,731 and 15 columns with no missing values. It includes integer columns (Age, End_type, Start_type, Registration_year, Target) and float columns (Education_level, Residence_type, Marital_status, Gender, Occupation, Religion, Altitude, Latitude, Longitude, Reason_for_migration) as shown at table 1 below. The distribution of migration classes in the dataset was examined prior to model training to assess potential class imbalance and we apply SMOTE techniques to increase to 133,731 and also balance the class distribution with the distribution of for non-migrate /active population 47,747 and for outmigration 85,984, Although the classes were moderately imbalanced, stratified sampling was used during dataset splitting to preserve class proportions across training, validation, and test sets.
Table1: Summary of the raw data key statistics for each column
|
Statistic |
Age |
Education |
Residence |
Marital |
End |
Gender |
Occupation |
|
level |
type |
status |
type |
||||
|
count |
114,612 |
114,612 |
114,612 |
114,612 |
114,612 |
114,612 |
114,612 |
|
mean |
30.12 |
1.5 |
0.27 |
0.82 |
0.42 |
0.51 |
2.53 |
|
std |
13.38 |
1.57 |
0.44 |
0.78 |
0.53 |
0.5 |
3.26 |
|
min |
2 |
0 |
0 |
0 |
0 |
0 |
0 |
|
max |
77 |
6 |
1 |
3 |
2 |
1 |
12 |
|
Religion |
Start |
Altitude |
Latitude |
Longitude |
Registration |
Reason for |
Target |
|
type |
year |
migration |
|||||
|
114,612 |
114,612 |
114,612 |
114,612 |
114,612 |
114,612 |
114,612 |
114,612 |
|
0.82 |
0.82 |
2426.87 |
15.69 |
37.79 |
2014.66 |
1.5 |
0.65 |
|
0.35 |
0.66 |
342.02 |
7.23 |
0.07 |
2.31 |
0.46 |
0.48 |
|
0 |
0 |
1448 |
12.03 |
37.37 |
2008 |
1 |
0 |
|
1 |
2 |
2996 |
35.08 |
38 |
2021 |
3 |
1 |
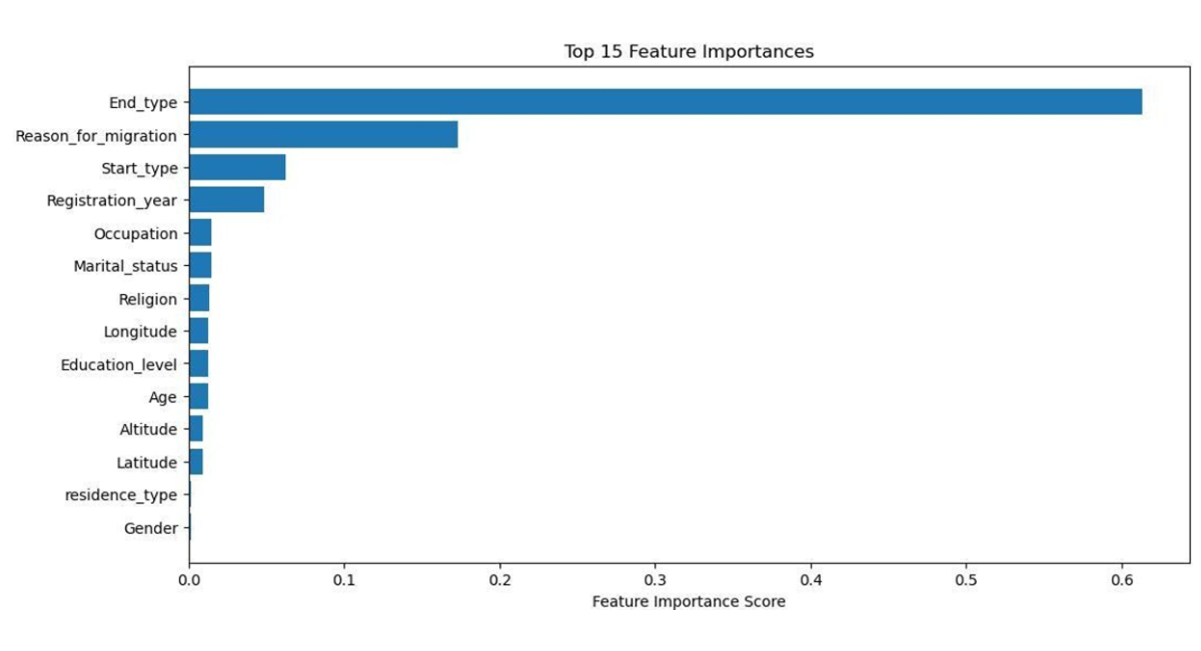
Figure 3: Feature importance score graph result from random forest classifier
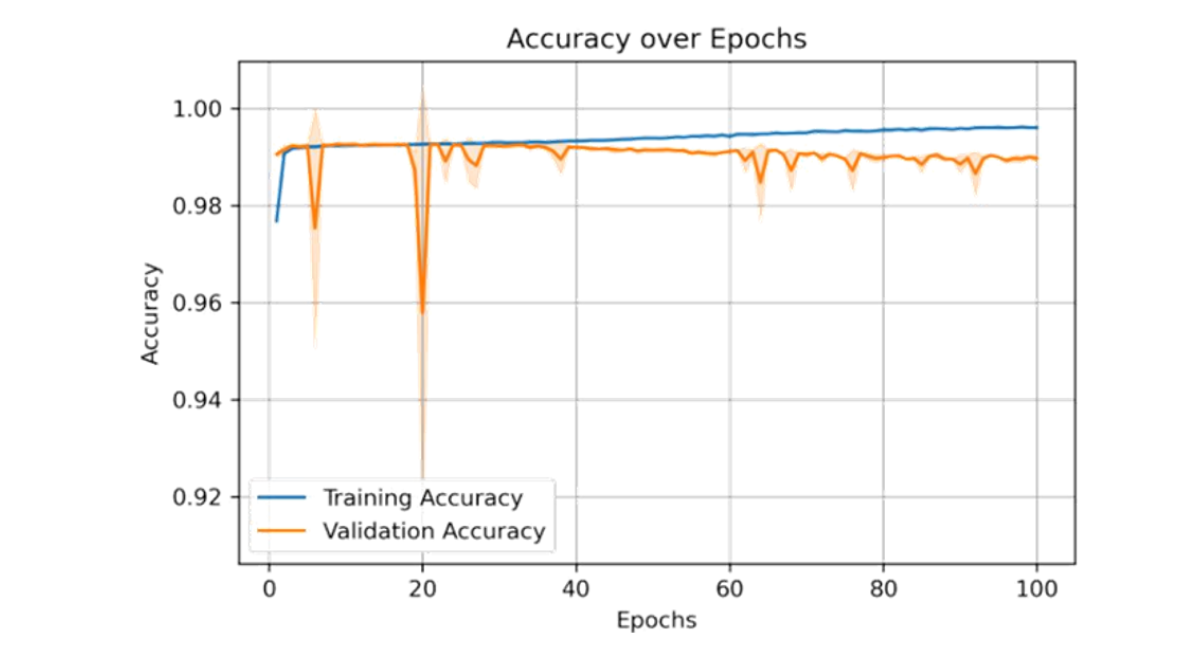
Figure 4: Accuracy vs epochs performance of the hybrid CNN_LSTM model after applying preprocessing techniques and parameter tuning
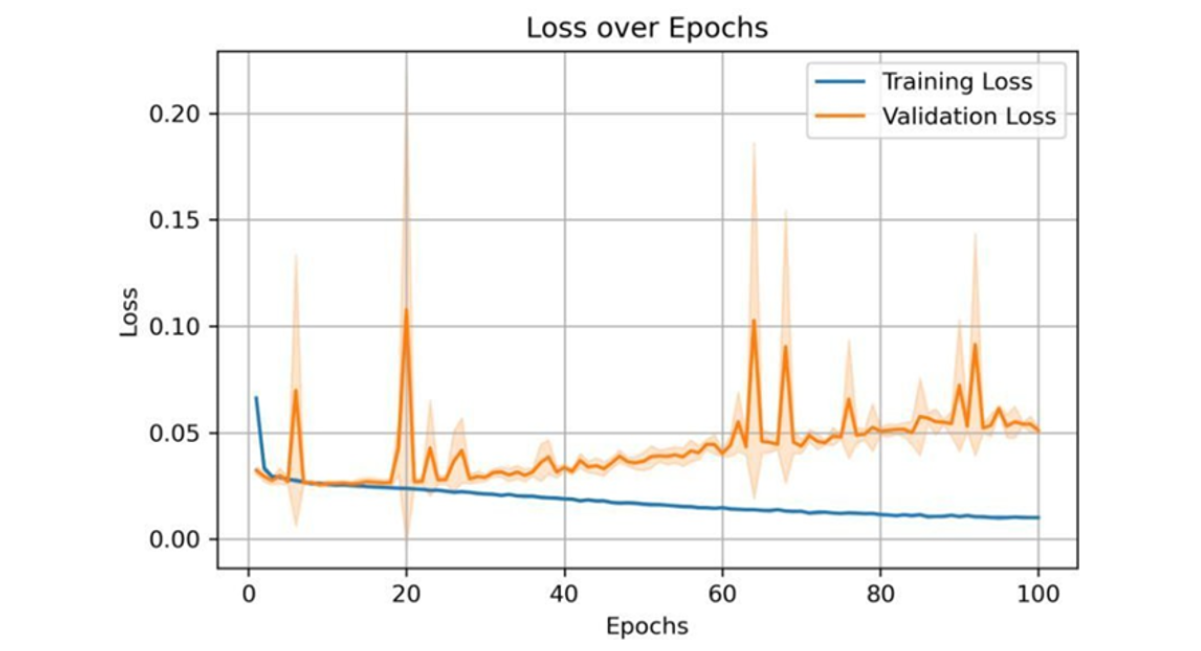
Figure 5: Loss vs epochs for the hybrid CNN–LSTM model after applying preprocessing techniques and parameter tuning
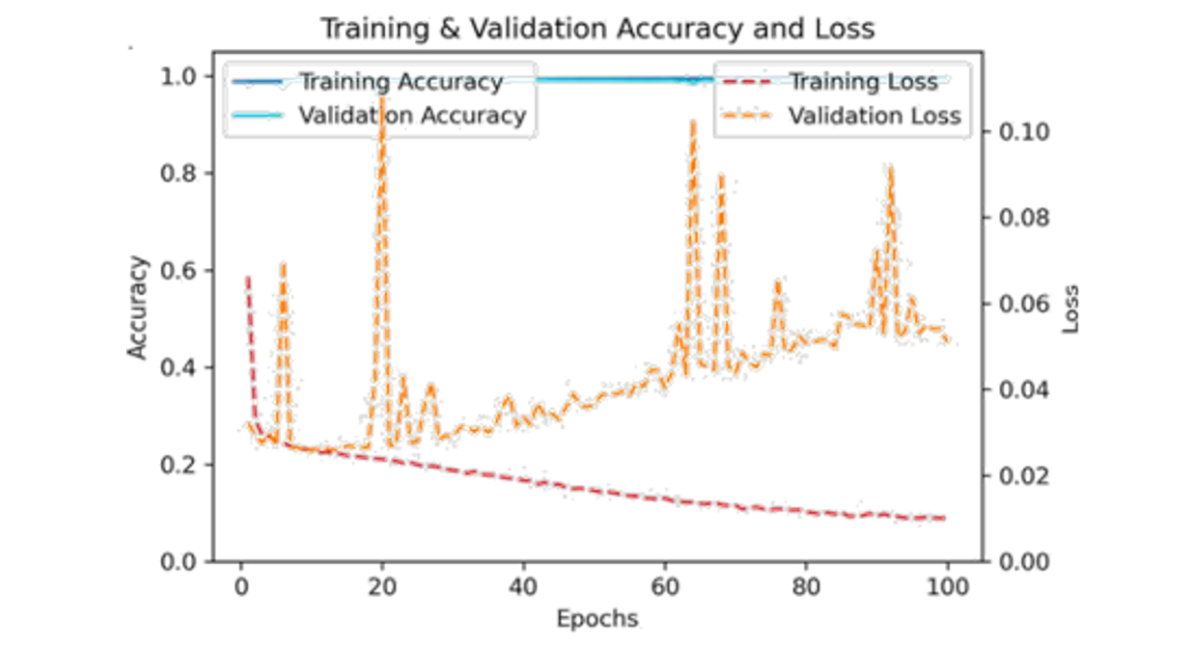
Figure 6: Performance of the hybrid CNN-LSTM model (accuracy and loss) following preprocessing and parameter tuning
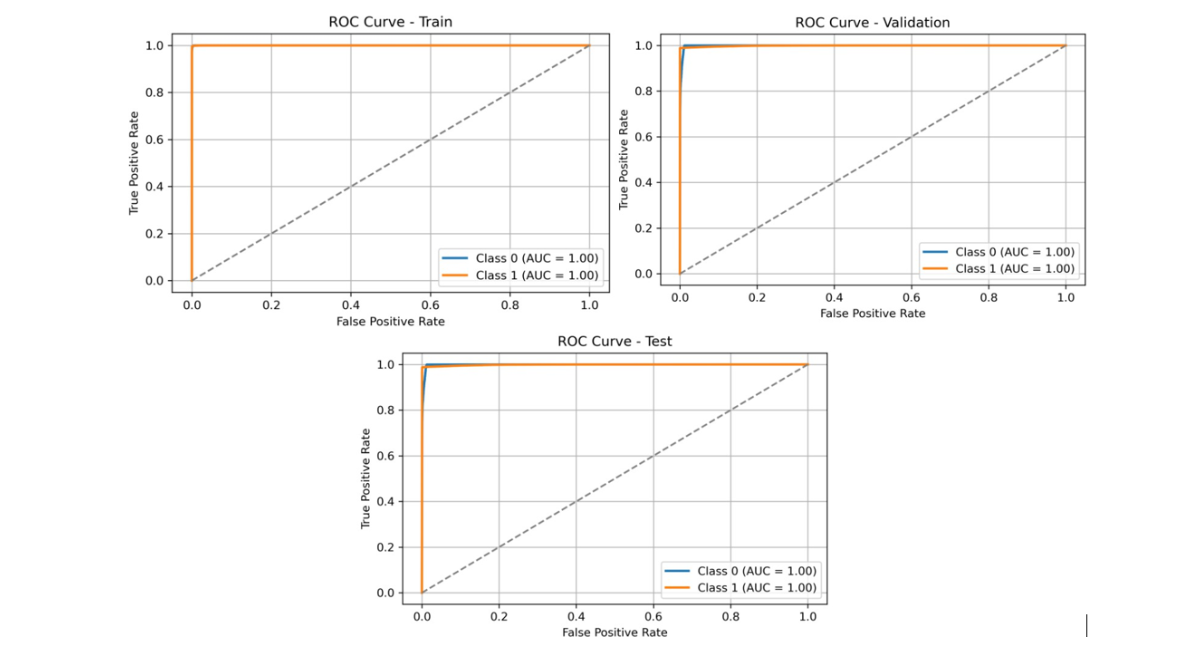
Figure 7: ROC curves of the hybrid CNN-LSTM model for the training, validation, and test sets, following the application of preprocessing techniques and parameter tuning
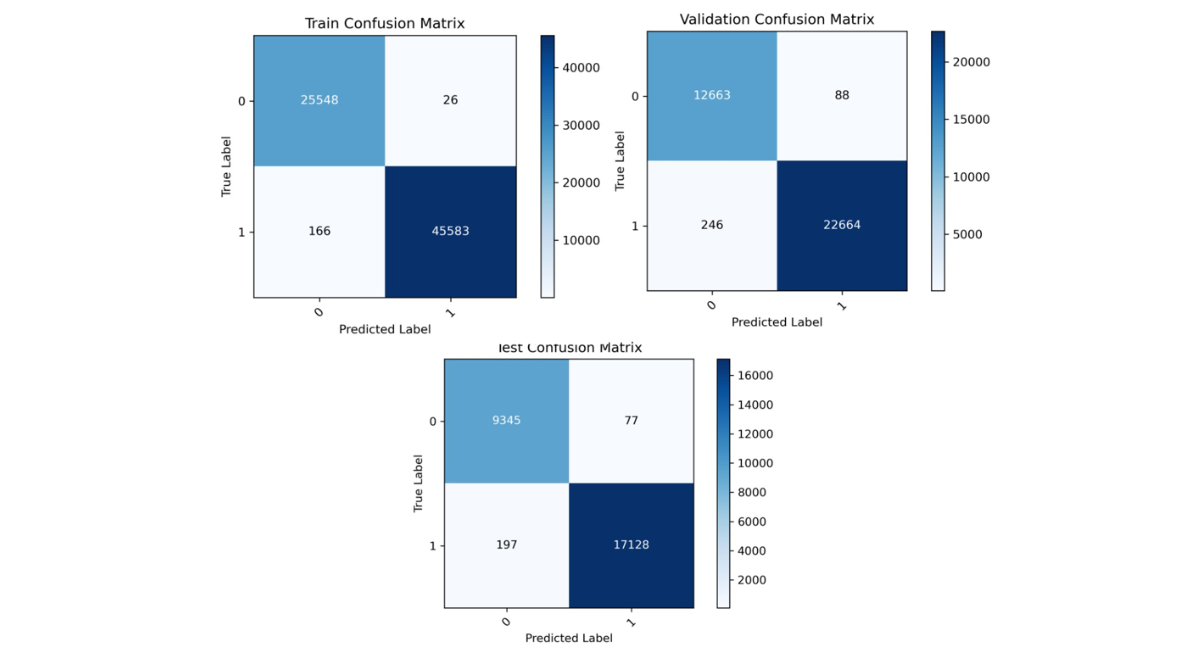
Figure 8: Confusion matrix of the hybrid CNN-LSTM model for the training, validation, and test sets after applying preprocessing techniques and parameter optimization
|
Metric |
Training |
Validation |
Test |
|
Accuracy |
0.996 |
0.9897 |
0.9898 |
|
Precision |
0.9972 |
0.9897 |
0.9898 |
|
Recall |
0.9972 |
0.9897 |
0.9898 |
|
F1 Score |
0.9972 |
0.9897 |
0.9898 |
Table 2: The accuracy, precision, recall, and F1 score of the hybrid CNN_LSTM model after applying preprocessing techniques and parameter optimization

Figure 9: GUI for user login

Figure 10: Dashboard GUI: Provides an overview of migration data, showing total records, predicted in- and out-migrants, and migration rates. Highlights hotspots, risk trends, demographic distributions, education impacts, key migration factors, feature analyses, and registration year patterns over time
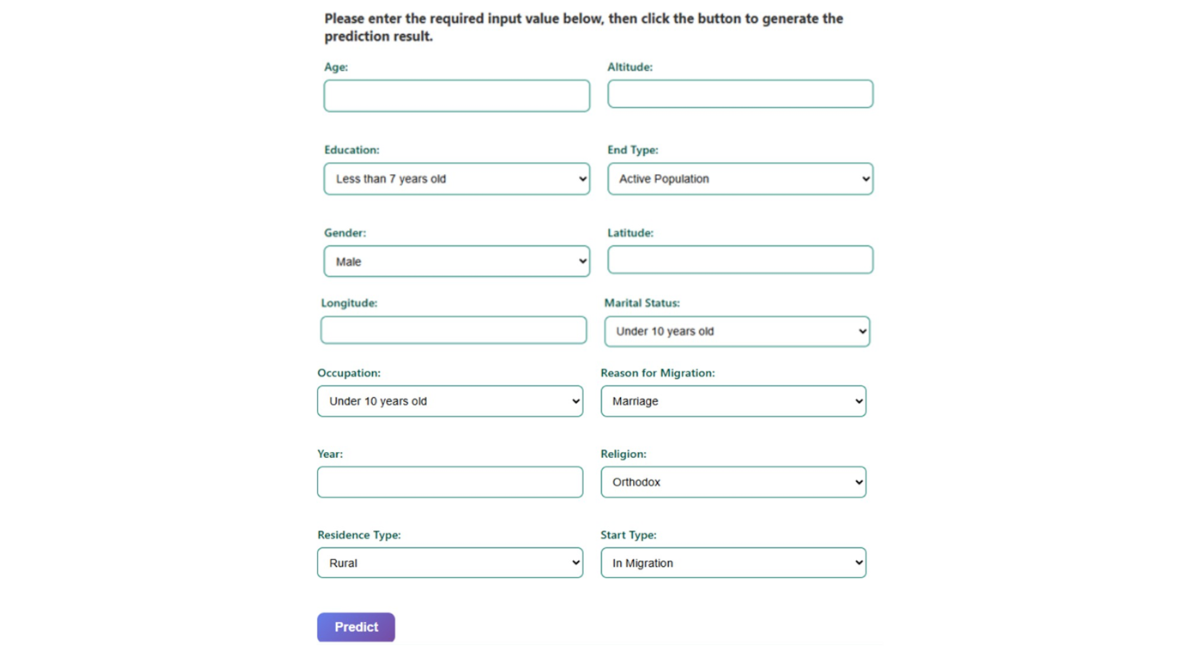
Figure 11: GUI for data entry form
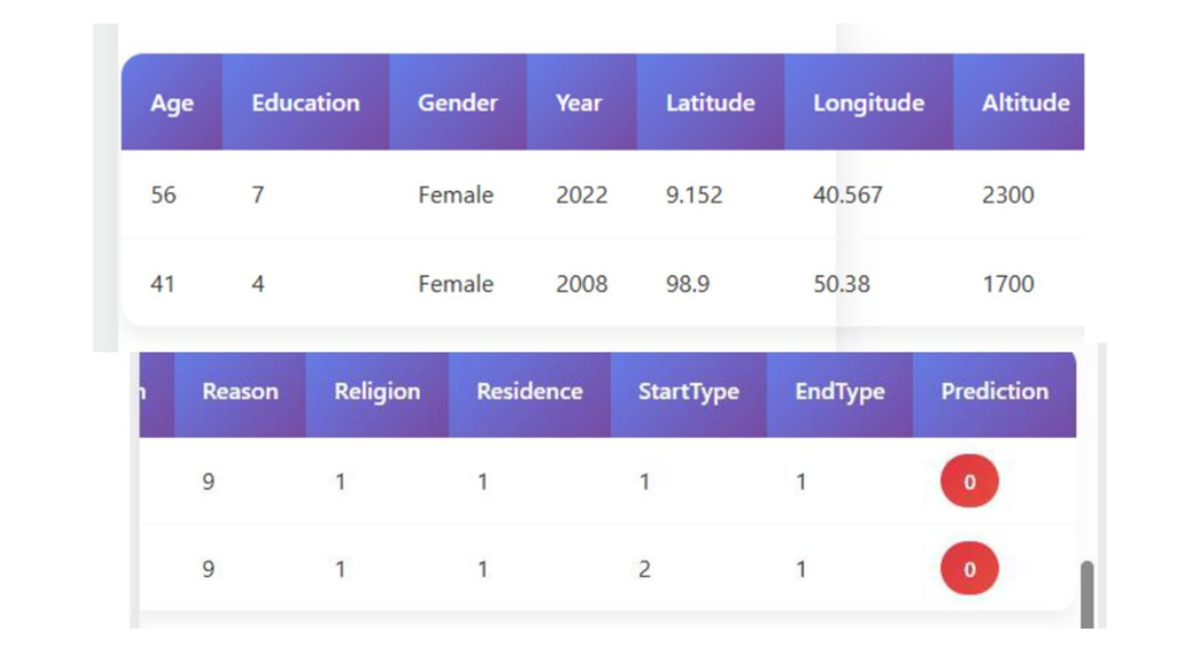
Figure 12: GUI for result summary
DISCUSSION
To realize the performance of the proposed hybrid CNN-LSTM model, results were compared with commonly used machine learning algorithms reported in previous migration prediction studies, including Decision Trees, Random Forest, Artificial Neural Networks, and XGBoost. These models typically achieve prediction accuracies between 70% and 98%, depending on the dataset and feature representation. The proposed hybrid CNN-LSTM model achieved a test accuracy of 98.98%, demonstrating competitive performance while providing the additional advantage of capturing both spatial and temporal dependencies in migration data. This study utilized a comprehensive dataset comprising 114,612 entries and 15 columns, containing no missing values. The dataset includes a mixture of integer (int64) and floating-point (float64) variables. Key numerical variables include Age, Altitude, Latitude, Longitude, and Registration_year. Descriptive statistics (Table 1) reveal an average age of approximately 30 years with a standard deviation of 13.38, spanning from 2 to 77 years. The Registration_year ranges from 2008 to 2021, averaging 2014.66. Categorical variables such as Education_level, Gender, and Occupation were encoded for analysis. To identify the most influential factors affecting migration prediction, feature importance scores were derived using a Random Forest Classifier. The results (Figure 3) indicate that End_type dominates with a feature importance score exceeding 0.6, followed by Reason_for_migration and Start_type, which also contribute substantially. Conversely, variables like Gender, residence_type, Latitude, and Altitude displayed minimal importance, suggesting limited predictive value in the model. The hybrid CNN-LSTM model’s performance was evaluated over 100 training epochs using accuracy, precision, recall, and F1 score metrics across training, validation, and test datasets. The training accuracy steadily increased, stabilizing near 1.00 by approximately epoch 40, while validation accuracy remained consistently above 0.98, albeit with minor fluctuations near epochs 20 and 65 (Figure 4). Concurrently, training loss decreased steadily throughout the epoch reflecting effective learning, whereas validation loss generally declined but exhibited noticeable spikes around epochs 20, 65, and 90, indicating occasional instability in validation (Figure 5). A combined view of accuracy and loss confirms these trends, with high and stable accuracies alongside low training loss, and intermittent spikes in validation loss highlighting moments of volatility (Figure 6). Receiver Operating Characteristic (ROC) curves for training, validation, and test sets further demonstrate the model’s discriminatory power, with an Area Under the Curve (AUC) of 1.00 for both Class 0 and Class 1 (Figure 7). Confusion matrix analysis for the test set (Figure 8) shows the model correctly classified 9,345 instances of Class 0 and 17,128 instances of Class 1, with only 77 false positives and 197 false negatives, underscoring the model’s high precision. Previously studies demonstrate that machine learning models are highly effective for predicting human migration. For instance, Robinson and Dilkina [11]. found that an ANN model was the top performer in their study, achieving a CPC of 0.68, an RMSE of 29.8, and an R2 of 0.71. The XGBoost model also exceeded the performance of traditional models and showed even better results when a specific production function was not included. These findings are supported by other studies. Aydemir et al. [25]. used XGBoost to achieve an impressive 98.37% accuracy in predicting migration patterns and socioeconomic factors. Additionally, Islam et al. [26]. Found that a Decision Tree model could predict successful migration outcomes with 80% accuracy, while a Random Forest model achieved 70%. While, our hybrid CNN-LSTM model achieved exceptional and balanced performance on the test set, with accuracy, precision, recall, and F1 score all reaching 0.9898 (Table 2). The training accuracy was 0.9960, while the validation and test accuracy were both very high at approximately 0.9898. The precision, recall, and F1-scores followed a similar pattern, with validation and test scores of 0.9897 and 0.9898 respectively, these results affirm the robustness and reliability of the hybrid CNN-LSTM approach for migration prediction. The User Login GUI (Figure 9) secures access with username and password authentication. Once logged in, users can navigate the dashboard and data entry forms. The Dashboard GUI (Figure 10) summarizes migration data, showing total records, predicted in-and out-migrants, and migration rates, along with visualizations like demographic distribution and key migration factors where Age ranks highest, followed by Latitude, Altitude, Education, and Year. The Data Entry Form GUI (Figure 11) allows users to input factors such as Age, Gender, Education, and location to generate predictions. The Result Summary GUI (Figure 12) provides a detailed record-by-record analysis, displaying attributes and predicted migration status, offering users insight into individual contributions to overall trends.
CONCLUSION
This study analyzed migration records across 15 variables, revealing key demographic and geographic trends. Categorical factors such as Education, Gender, and Occupation were encoded, and feature importance analysis highlighted End_type, Reason_for_migration, and Start type as the strongest predictors. The hybrid CNN-LSTM model achieved high predictive performance, with training, validation, and test accuracies, alongside consistently strong precision, recall, and F1 scores ROC curves and confusion matrices confirmed minimal misclassification and reliable generalization, supporting previous findings on machine learning efficacy in migration prediction. The developed GUI enhances usability by providing secure authentication, data visualization, and record-level prediction summaries. Thus, combining robust hybrid modeling with an interactive interface offers a practical tool for accurate migration analysis and informed policy making. However future studies required which focus on minimize limitation for example, the geographic scope of the dataset, which is derived exclusively from the Dabat Health and Demographic Surveillance System in North Gondar, Ethiopia. Migration dynamics observed in this dataset may reflect region-specific socioeconomic, demographic, and environmental conditions. Therefore, caution should be exercised when generalizing the results to other regions or countries. Future research should incorporate multi-regional datasets and cross-country migration data to improve model generalizability and robustness. Also, to improving data interoperability across different platforms and formats, incorporating additional relevant variables to capture a broader range of social, economic, and environmental factors, and leveraging advanced deep learning models for more accurate predictive analyses. Expanding the modeling framework in this way will strengthen the ability to anticipate migration trends, assess potential risks, and provide actionable insights for strategic planning and policy formulation. Ultimately, continued refinement and innovation in this area will contribute to more informed decision making and better outcomes in migration management.
AUTHORS’ CONTRIBUTIONS
- Bekele Mulat convinced the study, design the architecture, perform data preprocessing, devlop the model and GUI plus result analysis.
- Melkamu Abwa Bogale and Esubalew Asmare: data interpretation, methodlogical validation, and drafting the manuscript.
- Ewunate Assaye Kassaw and Ashenafi Fentahun: contributed to domain expertise, data contextualization, and evaluation of migration indicators.
- Engdaw Gulbet Tebege: contributed to geospatial analysis, study area mapping, and validation of spatial features. All authors reviewd, revised and approved the final manuscript and take full responsibility for its scientific content
ACKNOWLEDGEMENT
The authors declare that AI tool were use only for limited language editing purpose such as improve grammar, rephrase and readability of manuscript. the AI tool were not used for study design, data collection, datapreprocesing, model development, data analysis, result generation, interpretation. all scientific content, analyses, figures, and conclusions are the original work of the authors, who take full responsibility for the integrity and accuracy of the study.
REFERENCES
- McAuliffe M, Triandafyllidou A. Word migration report 2022. [Google Scholar] [Crossref]
- International Migrant Stock | Population Division. 2025. [Crossref]
- Dokubo EM, Sennuga SO, Omolayo AF, Bankole OL, Barnabas TM. Effect of rural-urban migration among the youths and its impacts on agricultural development in Kuje area council, Abuja, Nigeria. SciTech. 2023;4(2):12-27. [Google Scholar] [Crossref]
- Global Trends report 2024. UNHCR.
- International Migration Outlook 2024. OECD. [Crossref]
- Nations. International migration. United Nations.
- The A. C. for S. Studies. African Migration Trends to Watch in 2023. Africa Center for Strategic Studies.
- World Migration Report 2024 Reveals Latest Global Trends and Challenges in Human Mobility. International Organization for Migration.
- AI / Machine learning. Migration data portal.
- Islam SR, Moon NN, Islam MM, Hossain RA, Sharmin S, et al. Prediction of migration outcome using machine learning. InInternational conference on deep learning, artificial intelligence and robotics. 2021;pp.169-182. [Google Scholar]
- Robinson C, Dilkina B. A machine learning approach to modeling human migration. InProceedings of the 1st ACM SIGCAS Conference on Computing and Sustainable Societies. 2018;pp.1-8. [Google Scholar] [Crossref]
- Anakal S, Ravish GK, Sowjanya MN, Thejaswini MN, Mahalakshmi M, et al. Predictive analytics and machine learning in assessing migration patterns: A comparative study. Migration Letters. 2024;21:1557-1564. [Google Scholar]
- Bangole NK, Thanvitha L, Suraiya TB, Shashank YN, Harshith NL. Human Migration Analysis Using Machine Learning. InMedia Representation of Migrants and Refugees. 2024;pp.68-79. [Google Scholar]
- Predicting Migration Trends Using AI Models on Geopolitical and Climate Data. IJSRET. 2025. [Crossref]
- Fan C, Chen M, Wang X, Wang J, Huang B. A review on data preprocessing techniques toward efficient and reliable knowledge discovery from building operational data. Front. Energy Res. 2021;9:652801. [Crossref]
- Data Cleaning. GeeksforGeeks..
- Keita Z. Top Techniques to Handle Missing Values Every Data Scientist Should Know. DataCamp. [Google Scholar]
- S. V. Muralidhar, Outlier detection methods in Machine Learning. Towards Data Science. 2022. [Google Scholar]
- Normalization and Standardization. Shiksha Online.
- What Is Dimensionality Reduction? Meaning, Techniques, and Examples. Spiceworks.
- Rala Cordeiro J, Raimundo A, Postolache O, Sebastião P. Neural architecture search for 1D CNNs—Different approaches tests and measurements. Sensors. 2021;21(23):7990. [Google Scholar] [PubMed] [Crossref]
- Zhou L, Zhao C, Liu N, Yao X, Cheng Z. Improved LSTM-based deep learning model for COVID-19 prediction using optimized approach. Eng Appl Artif Intell. 2023;122:106157. [Google Scholar] [PubMed] [Crossref]
- Dalianis H. Evaluation metrics and evaluation. InClinical Text Mining: secondary use of electronic patient records. 2018; (pp. 45-53). [Google Scholar]
- Hasnain M, Pasha MF, Ghani I, Imran M, Alzahrani MY, et al. Evaluating trust prediction and confusion matrix measures for web services ranking. Ieee Access. 2020;8:90847-90861. [Google Scholar] [Crossref]
- Aydemir B, Aydın H, Çetinkaya A, Polat DŞ. Predicting the income groups and number of immigrants by using machine learning (ML). Int. J. Multidiscip. Stud. Innov. Technol. 2022;6(2):162-168. [Google Scholar] [Crossref]
- Islam SR, Moon NN, Islam MM, Hossain RA, Sharmin S, et al. Prediction of migration outcome using machine learning. Int. Conf. Deep Learn. Artif. Intell. Robot. 2021;(pp. 169-182). [Google Scholar]