




 Download PDF
ABSTRACT
Fusarium oxysporum is a destructive soilborne pathogen that causes vascular wilt and root rot in Cannabis sativa, limiting plant health and productivity under greenhouse production. This study evaluated the antagonistic and growth-promoting effects of plant growth-promoting microorganisms, namely Trichoderma asperellum, Bacillus velezensis, Bacillus amyloliquefaciens, and Microbacterium proteolyticum, against a pathogenic F. oxysporum isolate in vitro and in vivo. Dual-culture assays on Potato Dextrose Agar were used to determine inhibitory activity, while scanning electron microscopy was employed to examine pathogen–antagonist interactions. In greenhouse trials, the cannabis cultivar ‘Bergville’ was pretreated with each microorganism and challenged with F. oxysporum to assess disease incidence, disease severity, AUDPC, infection rates, and plant growth responses over 40 days.
All microbial treatments significantly suppressed F. oxysporum growth in vitro (p < 0.001). B. velezensis, B. amyloliquefaciens, and M. proteolyticum showed the strongest inhibition, whereas T. asperellum exhibited slower but clear antagonistic activity characterized by hyphal coiling and mycoparasitism. In vivo, all inoculated plants developed disease, but B. amyloliquefaciens provided the greatest reduction in disease progression, with the lowest AUDPC. T. asperellum and B. velezensis also reduced disease advancement, while M. proteolyticum promoted the greatest plant height despite limited biocontrol efficacy. Bacillus treatments improved leaf number and vegetative vigor, although total root and shoot biomass did not differ significantly among treatments.
These findings indicate that B. amyloliquefaciens, B. velezensis, and T. asperellum are promising biological control agents for sustainable management of F. oxysporum in cannabis production.
Keywords: Fusarium Oxysporum; Biocontrol; Cannabis Sativa
INTRODUCTION
Fusarium oxysporum is an important soilborne fungal pathogen responsible for vascular wilt and persistent yield losses in a wide range of hosts, including Cannabis sativa. In cannabis production, F. oxysporum has been associated with root browning, crown infection, yellowing, stunting, and plant death, and it has been recovered from diseased crowns, stems, pith tissues, roots, and even propagation systems, showing how readily it can spread through commercial facilities (Punja, 2020; Jerushalmi et al., 2022). As greenhouse and controlled-environment cannabis production has expanded, disease pressure has increased alongside it, with Fusarium and Pythium among the principal root pathogens affecting this crop (Punja & Rodríguez, 2018; Gwinn et al., 2022).
Management of Fusarium wilt in cannabis remains constrained. Recent reviews note that biopesticides are available for use on C. sativa, but few efficacy trials have been performed, and producers still have limited management options in the absence of registered chemical fungicides (Gwinn et al., 2022; Scott & Punja, 2023). This has made biological control an increasingly important component of integrated disease management. Trichoderma spp. and bacterial biocontrol agents, particularly Bacillus spp., are especially promising because they can suppress fungal pathogens through direct antimicrobial activity, competition for nutrients and space, and induction of host systemic resistance (Boulahouat et al., 2023). In cannabis systems, Trichoderma- and Bacillus-based products have reduced disease severity under greenhouse conditions, and beneficial bacteria have also shown activity against Fusarium through dual-culture inhibition and in planta suppression (Scott & Punja, 2023; Pellegrini et al., 2021; Corredor-Perilla et al., 2023).
Cannabis-specific studies support this direction. In a greenhouse trial, several biological-control products reduced mean disease severity in Fusarium-inoculated cannabis cuttings, with the most effective treatments including Trichoderma- and Bacillus-based products (Scott & Punja, 2023). A separate study reported that a plant growth-promoting bacterial consortium counteracted Fusarium infection both pre-emergence and post-emergence (Pellegrini et al., 2021). Another cannabis study found significant inhibition of Fusarium oxysporum mycelial growth by several Bacillus strains, further supporting the potential of rhizobacterial antagonists for sustainable disease management (Corredor-Perilla et al., 2023). However, the evidence remains fragmented across microbial taxa, formulations, and production systems, and direct comparisons among candidate agents are still scarce (Gwinn et al., 2022; Ahsan et al., 2025).
Against this background, the present study evaluated Trichoderma asperellum, Bacillus velezensis, Bacillus amyloliquefaciens, and Microbacterium proteolyticum against F. oxysporum in the cannabis cultivar ‘Bergville’ under greenhouse conditions. The antagonistic activity of these agents was assessed using dual-culture assays on Potato Dextrose Agar, with Bell’s rating scale used to quantify antagonism and scanning electron microscopy employed to examine the physical interactions between the pathogen and the biocontrol agents at the microscopic level (Pellegrini et al., 2021). By comparing disease progression and growth responses across these antagonists, the study aimed to identify biological control agents with potential for suppressing Fusarium wilt while preserving plant vigour and biomass under pathogen challenge.
METHODS AND MATERIALS
Bell’s test for Trichoderma asperellum vs F. oxysorum
To assess the antagonistic interaction between T. asperellum and the pathogenic fungus F. oxysporum, a dual culture assay was performed using Potato Dextrose Agar (PDA) in Petri plates (Figure 1). A 5 mm mycelial plug of F. oxysporum was inoculated on one side of the PDA plate, and a plug of T. asperellum was placed on the opposite side, equidistant from the center. The plates were incubated at 25˚C (room temperature) for 3-7 days, after which the interaction between the two fungi was evaluated using Bell’s rating scale. This scale ranges from 1 to 5, where a rating of 1 indicates that Trichoderma completely overgrew the pathogen, covering the entire plate, and a rating of 5 indicates complete overgrowth of Trichoderma by the pathogen with no inhibition observed. Intermediate ratings reflect varying levels of growth and inhibition between the two organisms. Lower scores (1–2) denote strong antagonism by Trichoderma, whereas higher scores (4–5) indicate weak or no antagonistic effect.
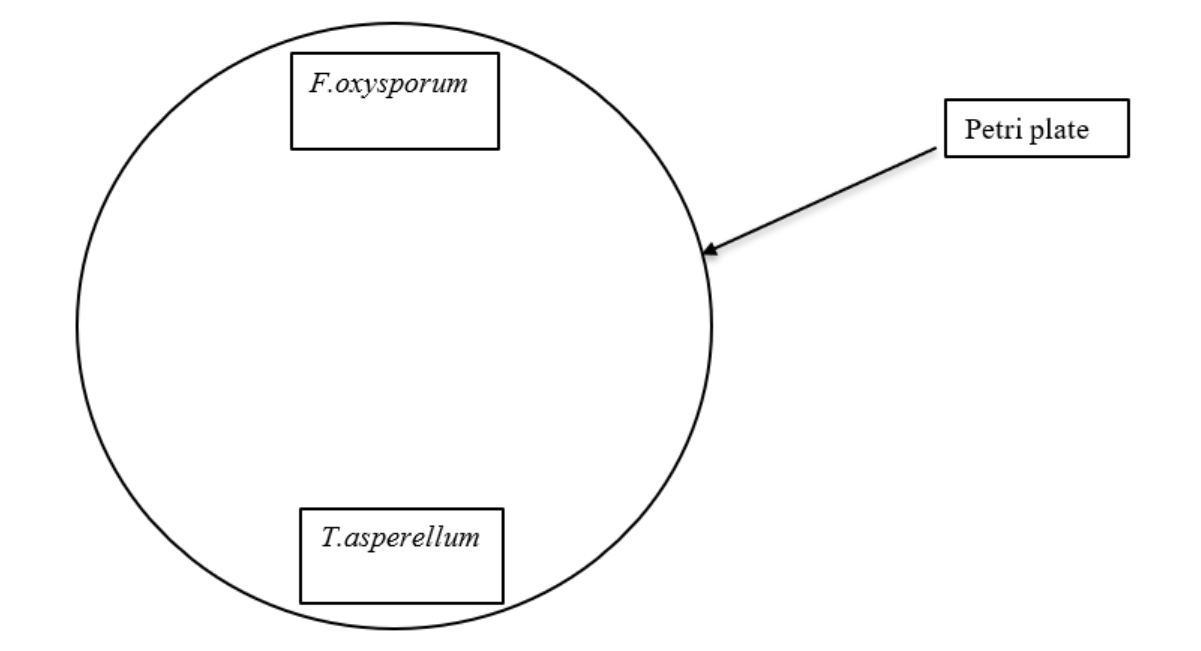
Figure 1: Dual culture assay showing antagonistic interaction between F. oxysporum and T. asperellum on Potato Dextrose Agar (PDA). A mycelial plug of F. oxysporum was placed on one side of the Petri plate, while a plug of T. asperellum was inoculated on the opposite side. The interaction zone between the two fungi was observed after incubation and rated using Bell’s scale to assess the level of antagonism.
In Vitro Antagonism Assay Between F. oxysporum and Bacterial Isolates
To evaluate the antagonistic potential of bacterial isolates against F. oxysporum, a dual culture bioassay was performed on Petri dishes containing a suitable growth medium, PDA. Each plate was first labelled and marked on the bottom to indicate the central point for fungal inoculation and the positions around the edge for bacterial streaks. A 5 mm agar plug of actively growing F. oxysporum culture was placed at the center of the plate using sterile forceps or a scalpel. Pure bacterial cultures were then streaked using a sterile inoculating loop in straight lines, starting 15cm away from the edge of the plate (Figure 2). Bacterial species used include Bacillus velezensis, Bacillus amyloliquefaciens and Microbacterim proteolyticum. Plates were incubated at 25°C for 3–7 days. Post incubation, the interaction zones were carefully observed for evidence of antagonism, such as clear zones of inhibition, overgrowth, pigment production, or changes in fungal morphology near the bacterial streaks. Observations included the distance between growth fronts and any visible signs of hyphal degradation, which served as indicators of the biocontrol efficacy of the bacterial isolates [1-7].
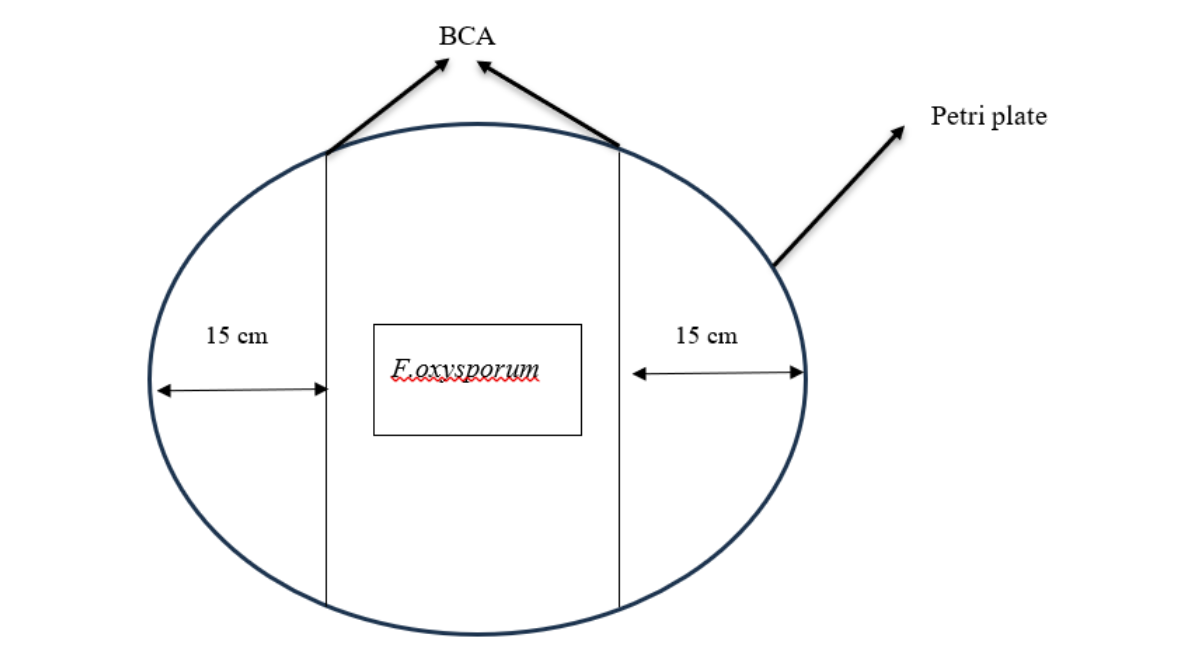
Figure 2: Schematic representation of the in vitro antagonism assay between F. oxysporum and bacterial biocontrol agents (BCAs). A 5 mm plug of F. oxysporum was placed at the center of a Petri plate containing a suitable growth medium, while bacterial isolates were streaked equidistantly around the periphery. The setup was incubated at 25–30°C for 3–7 days to observe inhibitory interactions such as growth suppression, zones of inhibition, or morphological changes in the fungal colony.
Control Culture Preparation of F. oxysporum
To establish a control for fungal growth, F. oxysporum was cultured on PDA in sterile Petri dishes. Each plate was labelled on the bottom with " F. oxysporum Control," along with the date and initials. Using cork borer, a 5 mm agar plug was excised from the actively growing edge of a F. oxysporum culture. The plug was then transferred to the center of a fresh PDA plate using sterile forceps, ensuring the mycelium side was in contact with the medium. The plates were sealed with parafilm to prevent contamination and desiccation, while allowing minimal gas exchange. Plates were incubated at 25°C for 3–7 days. Radial growth from the center was measured at intervals in millimetres, and colony characteristics such as colour, texture, sporulation, and pigment production were recorded for comparative analysis with treated plates.
Scanning Electron Microscopy (SEM)
Scanning Electron Microscopy (SEM) was conducted to observe and compare the surface morphology of the samples. Samples were first fixed in 3% buffered glutaraldehyde for 1–3 hours to preserve cellular and structural integrity. Following fixation, samples were dehydrated gradually through a graded ethanol series consisting of 10%, 30%, 50%, 70% and 90% ethanol for 10 minutes each, followed by three final washes in 100% ethanol to ensure complete removal of water. The fully dehydrated samples were then subjected to critical point drying using a Quorum K850 Critical Point Dryer, where ethanol was progressively replaced with liquid CO₂ and subsequently brought to its critical point (~35°C and ~1200–1300 psi), allowing the transition from liquid to gas without surface tension forces that could otherwise collapse or distort fine surface structures. Once dried, the samples were mounted on aluminium SEM stubs using carbon adhesive tabs, ensuring proper orientation and secure placement. A thin conductive layer of gold was then applied using a Quorum Q150RES Sputter Coater to enhance surface conductivity and minimize charging during electron beam exposure. The prepared samples were examined using a Zeiss EVO LS15 scanning electron microscope operated under high-vacuum conditions at an accelerating voltage appropriate for biological specimens. Micrographs were captured at multiple magnifications to visualise overall surface architecture as well as fine microstructural features relevant to the study. This imaging approach enabled detailed comparison of fungal colony morphology on PDA plates, allowing assessment of differences in hyphal structure, surface texture, and growth characteristics between treatments.
Plant Material and Experimental Setup
The cannabis cultivar 'Bergville' was used for all in vivo trials. Healthy, uniform seedlings were grown under controlled greenhouse conditions to ensure consistent growth prior to treatments.
Preparation of Biological Control Agents (BCAs)
Pure cultures of Trichoderma asperellum, Bacillus velezensis, Bacillus amyloliquefaciens, and Microbacterium proteolyticum were obtained from microbial culture collections. Each BCA was cultured in PDA, and spore or cell suspensions were prepared and standardized to a concentration of 1 × 10⁸ colony-forming units (CFU)/mL for bacterial agents and 1 × 10⁸ spores/mL for fungal agents.
Pathogen Preparation
F. oxysporum was cultured on PDA plates and incubated at 25°C for 7 days. Spore suspensions were harvested and adjusted to 1 × 10⁵ conidia/mL for inoculation.
Inoculation Procedure
Prior to inoculation, 'Bergville' seedlings were stressed by covering with plastic bags for 24 hours to create a high-humidity environment that weakens plant defenses. Following this stress period, each plant was treated with a soil drench of 20 mL of the respective biological control agent suspension at 1 × 10⁸ CFU/mL or spores/mL around the root zone. After 48 hours, plants were inoculated by soil drenching with 20 mL of F. oxysporum spore suspension adjusted to 1 × 10⁵ conidia/mL. Control groups included stressed plants treated only with pathogen inoculum and stressed plants receiving sterile distilled water.
Experimental Design
The experiment was conducted in a completely randomized design (CRD) comprising six treatment groups with three replications per treatment and three pots per replication, totalling 54 pots. The treatment groups were as follows:
(F. oxysporum) + (Trichoderma asperellum)
(F. oxysporum) + (Bacillus velezensis)
(F. oxysporum) + (Bacillus amyloliquefaciens)
(F. oxysporum) + (Microbacterium proteolyticum)
(F. oxysporum only (positive control))
(Sterile water only (negative control))
Data Collection
Plants were monitored for disease incidence and severity, as well as growth parameters such as plant height, leaf number, vascular wilting over a period of forty days. Other parameters such as dry root mass. Disease severity was scored using a standard rating scale. Plant and root wet and dry mass was recorded. Plant material was dried for 48 hours at 65˚C in an industrial plant oven.
Statistical Analysis
Data were subjected to ANOVA and means were separated using Duncan’s Multiple Range Test.
RESULTS
|
Source of variation |
d.f. |
s.s. |
m.s. |
v.r. |
F pr. |
|
REPLICATES stratum |
2 |
3.8 |
1.9 |
0.13 |
|
|
REPLICATES. *Units* stratum |
4 |
29919 |
7479.8 |
494.51 |
<.001 |
|
TREATMENTS |
|||||
|
Residual |
83 |
1255 |
15.13 |
||
|
Total |
89 |
31178 |
Table 1: Analysis of Variance (ANOVA) Table for Treatment Effects on Mycelial Growth of F. oxysporum day 3.
The ANOVA results (Table 1) show that treatments had a highly significant effect (p < 0.001) on the mycelial growth of F. oxysporum at day 3, with a very large variance ratio (v.r. = 494.51). Replicates had no significant effect, and most of the variation in growth was explained by the treatment differences rather than random error.
|
Source of variation |
d.f. |
s.s. |
m.s. |
v.r. |
F pr. |
|
REPLICATES stratum |
2 |
3.8 |
1.9 |
0.13 |
|
|
REPLICATES.*Units* stratum |
4 |
29919.18 |
7479.79 |
494.51 |
<.001 |
|
TREATMENTS |
|||||
|
Residual |
83 |
1255.42 |
15.13 |
||
|
Total |
89 |
31178.4 |
Table 2: Analysis of Variance (ANOVA) Table for Treatment Effects on Mycelial Growth of F. oxysporum day 5.
The ANOVA results (Table 2) indicate that treatments had a highly significant effect (p < 0.001) on the mycelial growth of F. oxysporum at day 5, with an extremely high variance ratio (v.r. = 951.48). Replicates showed no significant effect, and almost all variation in growth was attributed to treatment differences rather than experimental error.
|
Source of variation |
d.f. |
s.s. |
m.s. |
v.r.. |
F pr. |
|
REPLICATES stratum |
2 |
5.356 |
2.678 |
0.37 |
|
|
REPLICATES. *Units* stratum |
4 |
27351.16 |
6837.789 |
951.48 |
<.001 |
|
TREATMENTS |
|||||
|
Residual |
83 |
596.478 |
7.186 |
||
|
Total |
89 |
27952.99 |
Table 3: Analysis of Variance (ANOVA) Table for Treatment Effects on Mycelial Growth of F. oxysporum day 7.
The ANOVA results (Table 3) show that treatments had a highly significant effect (p < 0.001) on the mycelial growth of F. oxysporum at day 7, with a very high variance ratio (v.r. = 879.71). Replicates had no significant effect, and the majority of variation in growth was due to treatment differences rather than random error.
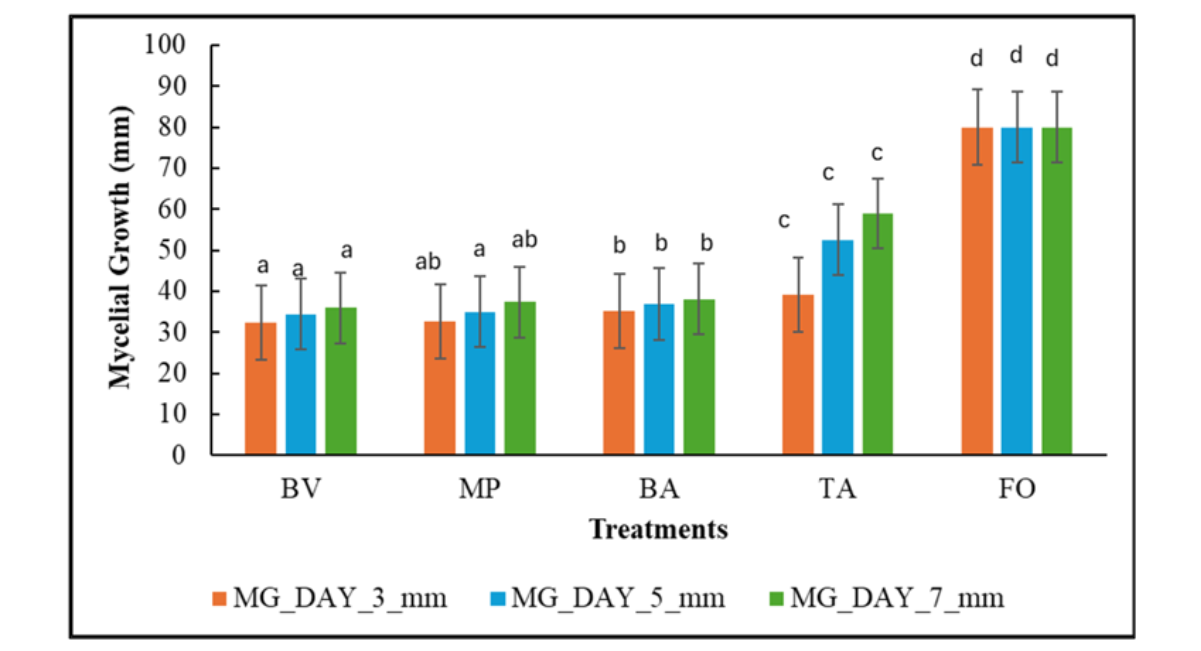
Figure 3: Mean mycelial growth (mm) of F. oxysporum on different treatments (BA, BV, FO, MP, TA) measured at 3-, 5-, and 7-days post-inoculation. Data represent means ± standard error as calculated using GenStat® 23rd Edition.
The bar graph (Figure 3) shows the mean mycelial growth of F. oxysporum under five treatments (BA, BV, FO, MP, TA) at 3-, 5-, and 7-days post-inoculation. Growth was highest in the FO treatment (~80 mm) across all days, while BA, BV, and MP exhibited much lower growth (~30–40 mm). TA showed moderate growth (~40 mm on day 3, increasing to ~60 mm by day 7). Error bars indicate standard error, with FO displaying the greatest and most consistent growth over time, and TA showing noticeable increases between days 3 and 7.
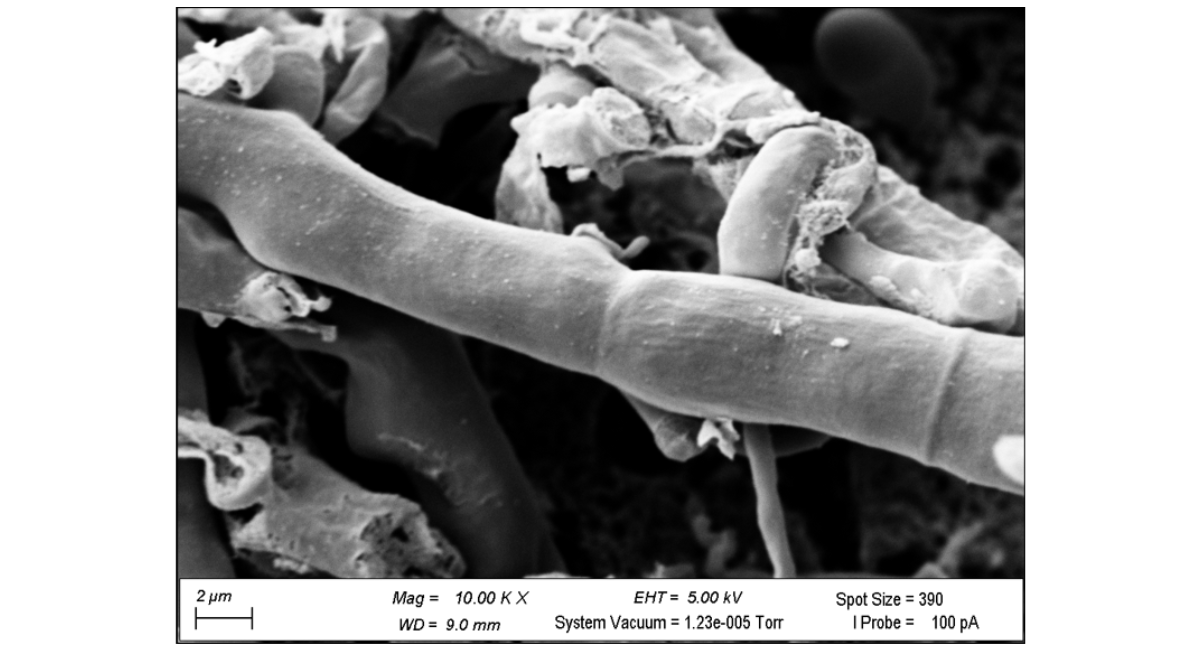
Figure 4: Scanning electron micrograph (SEM) of F. oxysporum isolated from C. sativa showing hyphal structures at 10,000× magnification. The image reveals smooth, septate hyphae with visible branching and intertwined mycelial networks, characteristic of the fungal morphology. Imaging was performed at an accelerating voltage of 5.00 kV and a working distance of 9.0 mm.
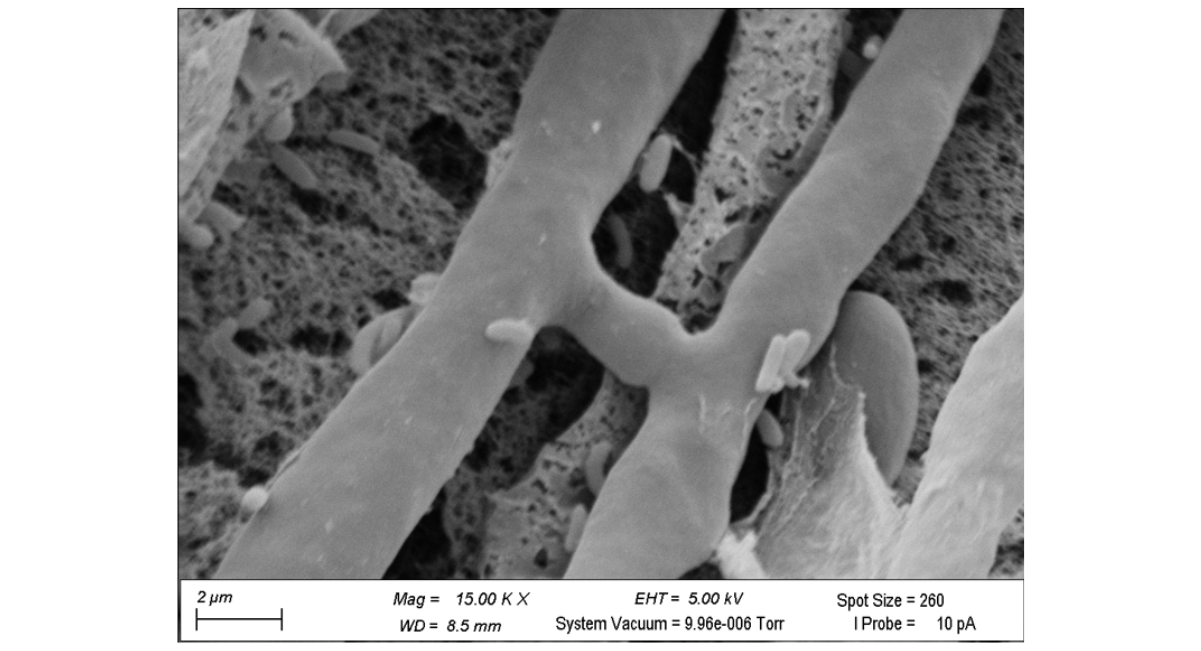
Figure 5: Scanning electron micrograph (SEM) of F. oxysporum isolated from C. sativa showing septate hyphae with branching and attached microconidia at 15,000× magnification. The smooth, tubular hyphal structures and ellipsoidal conidia are clearly visible, characteristic of F. oxysporum morphology. Imaging was performed at an accelerating voltage of 5.00 kV and a working distance of 8.5 mm.
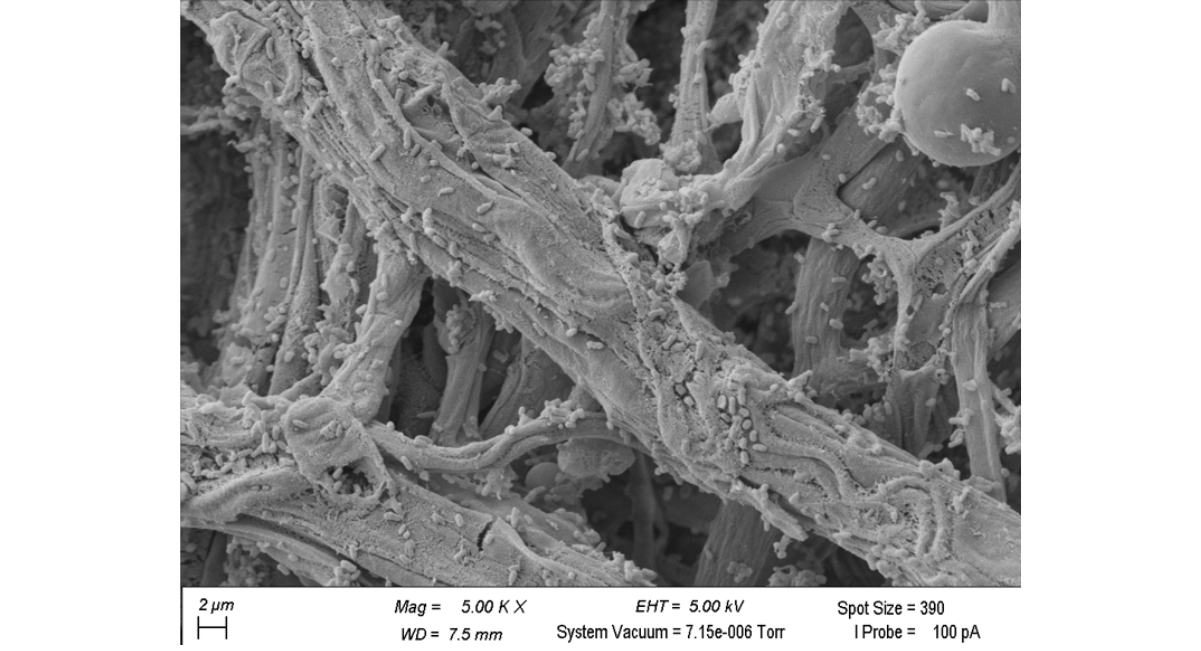
Figure 6: Scanning electron micrograph (SEM) showing the interaction between T. asperellum and F. oxysporum at 5,000× magnification. The image reveals extensive hyphal intertwining, coiling, and surface colonization, with numerous conidia of T. asperellum visible on and around the F. oxysporum hyphae, indicating antagonistic activity. Imaging was performed at an accelerating voltage of 5.00 kV and a working distance of 7.5 mm.
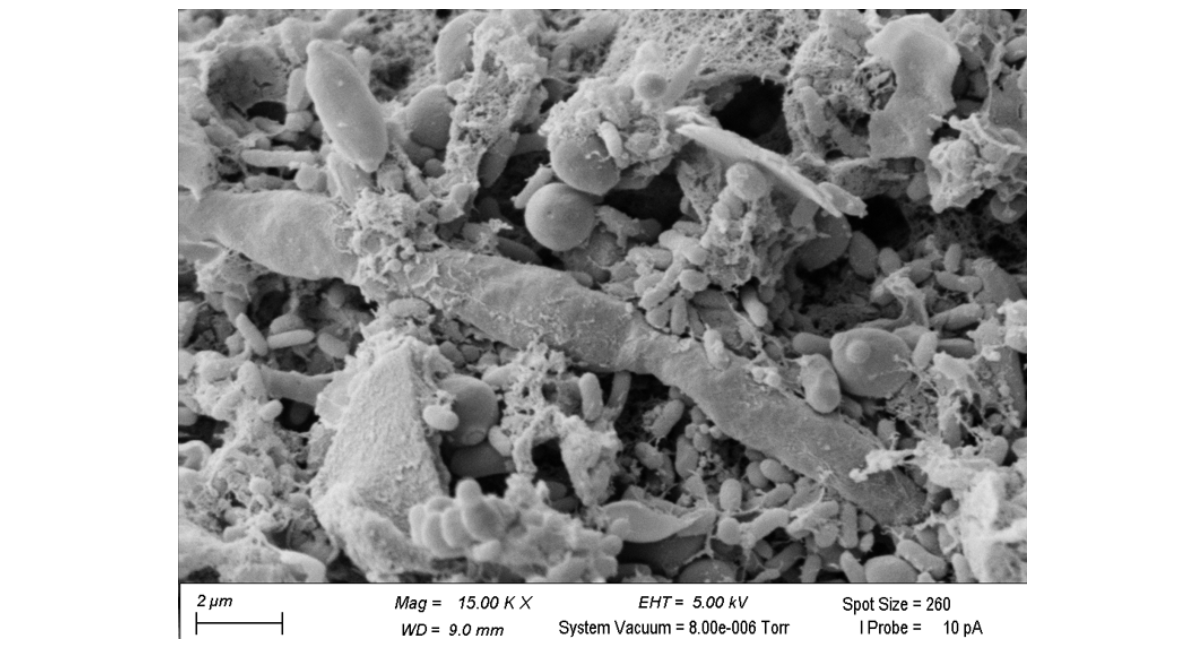
Figure 7: Scanning Electron Micrograph (SEM) of the interaction between B. velezensis and F. oxysporum isolated from C. sativa. The image, captured at 15.00K X magnification, clearly shows the co-existence of different microbial forms. Rod-shaped bacterial cells ( B. velezensis) are densely clustered and adhere to the surfaces of larger, elongated fungal hyphae and spherical to ovoid fungal spores/conidia (characteristic structures of F. oxysporum). A significant amount of visible extracellular matrix (biofilm) surrounds the organisms, suggesting active colonization and potential antagonistic interaction between the bacteria and the fungus. Imaging was performed at an accelerating voltage (EHT) of 5.00 kV and a working distance (WD) of 9.0mm. The scale bar represents 2µm.
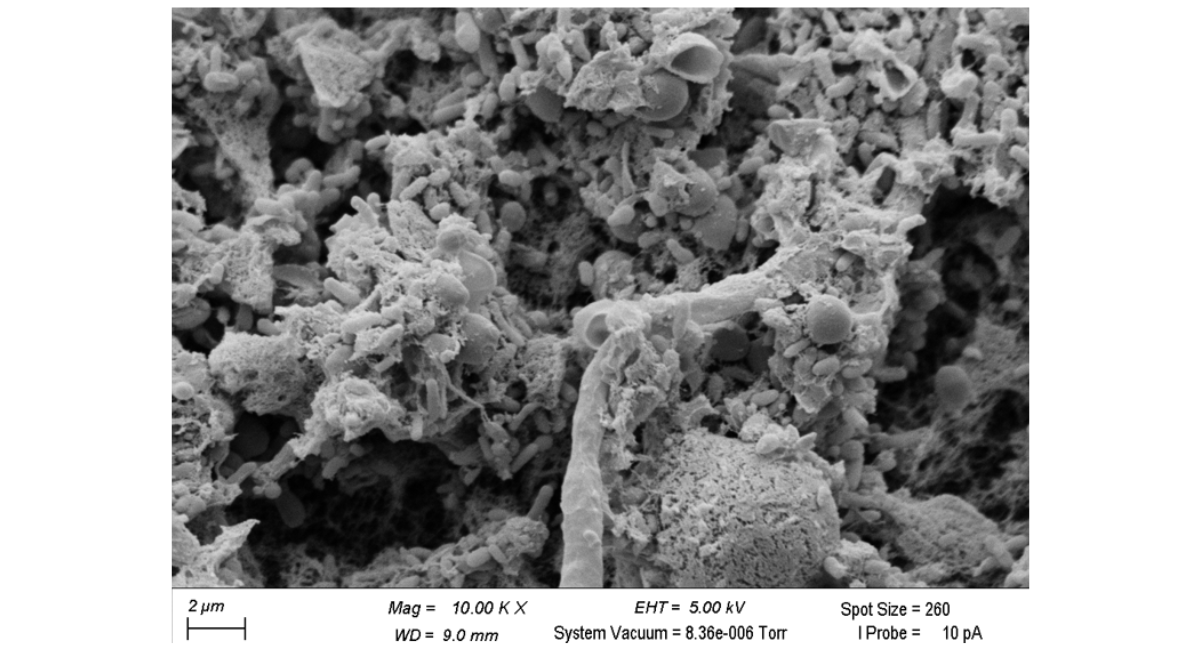
Figure 8: Scanning Electron Micrograph (SEM) of the interaction between B. velezensis and F. oxysporum isolated from C. sativa. The image, captured at 10.00K X magnification, illustrates a dense, mixed microbial community. A dominant thick fungal hypha ( F. oxysporum) is visible, surrounded and heavily coated by numerous rod-shaped bacterial cells ( B. velezensis). Spherical to ovoid fungal spores/conidia are also present, embedded within an extensive network of extracellular matrix (biofilm) material. This close association suggests active antagonism or biocontrol activity of the bacterium against the pathogenic fungus. Imaging was performed at an accelerating voltage (EHT) of 5.00 kV and a working distance (WD) of 9.0mm. The scale bar represents 2µm.
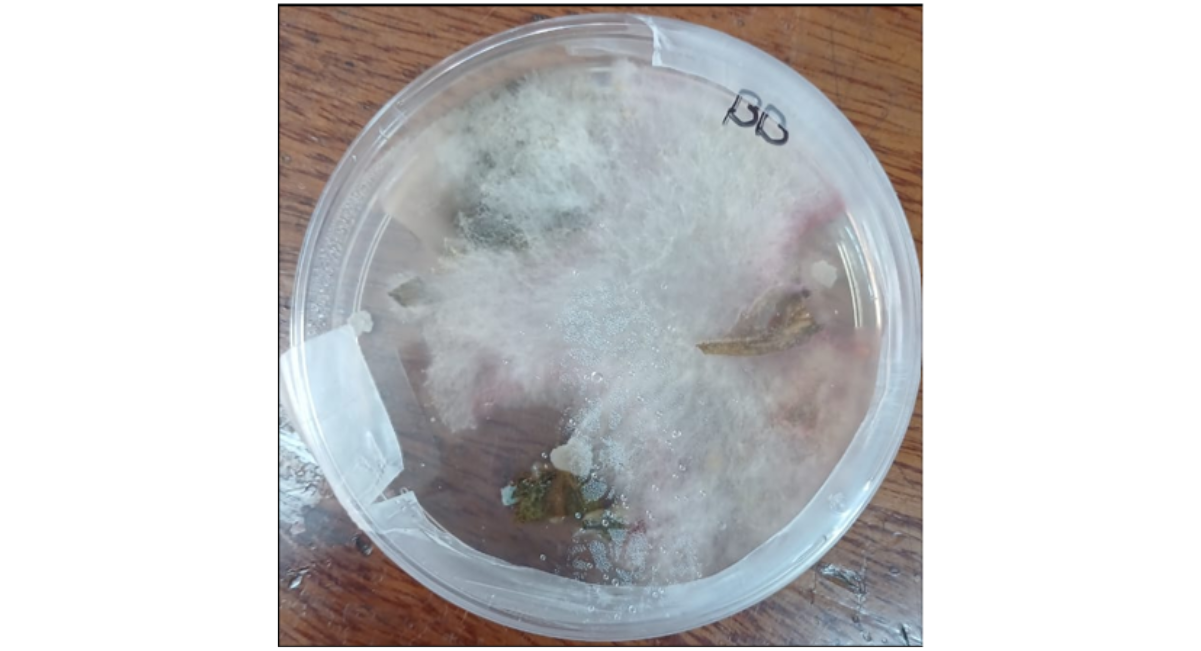
Figure 9: Macroscopic morphology of a pathogenic F. oxysporum isolate recovered from inflorescences (flowers) of a 'Blueberry Cannabis' plant. The culture, grown on PDA, exhibits the typical fast-growing colony with dense, cottony (floccose) aerial mycelium. The colony often develops a light pink or purple pigmentation visible in the mycelium or on the reverse side of the Petri dish, indicative of a Fusarium species. This isolate is associated with vascular wilt of C. sativa.
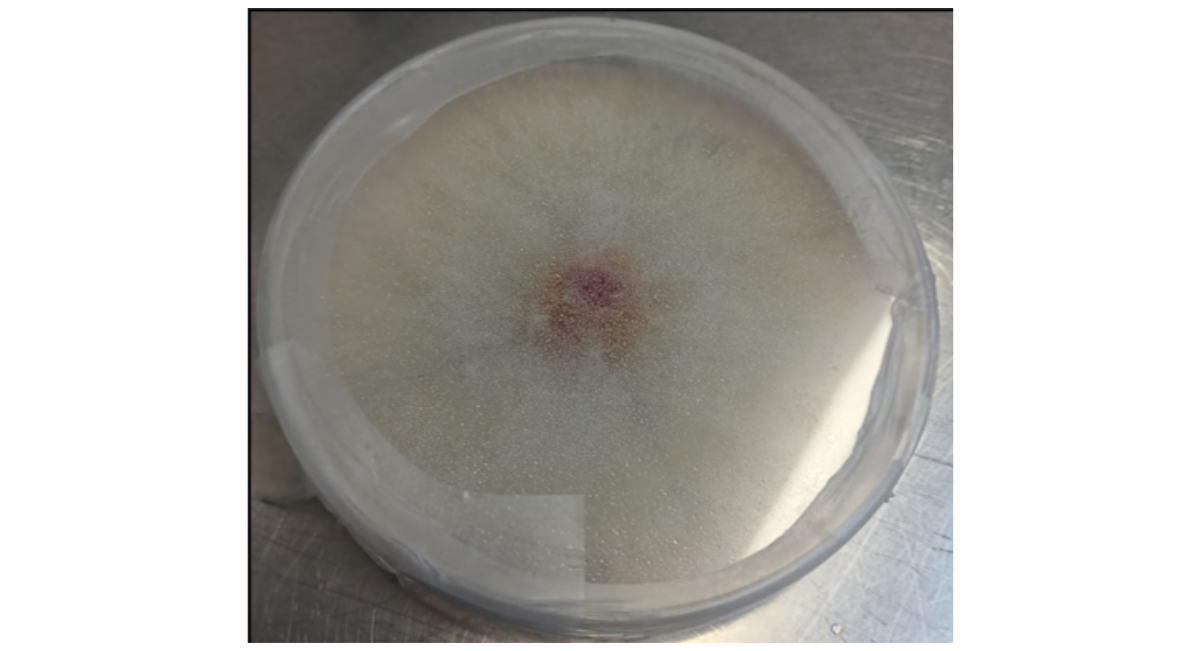
Figure 10: Pure culture of F. oxysporum grown on Potato Dextrose Agar (PDA). Note the characteristic fluffy, white to pinkish aerial mycelium on the upper surface and the deep purple pigmentation observed on the reverse of the plate.
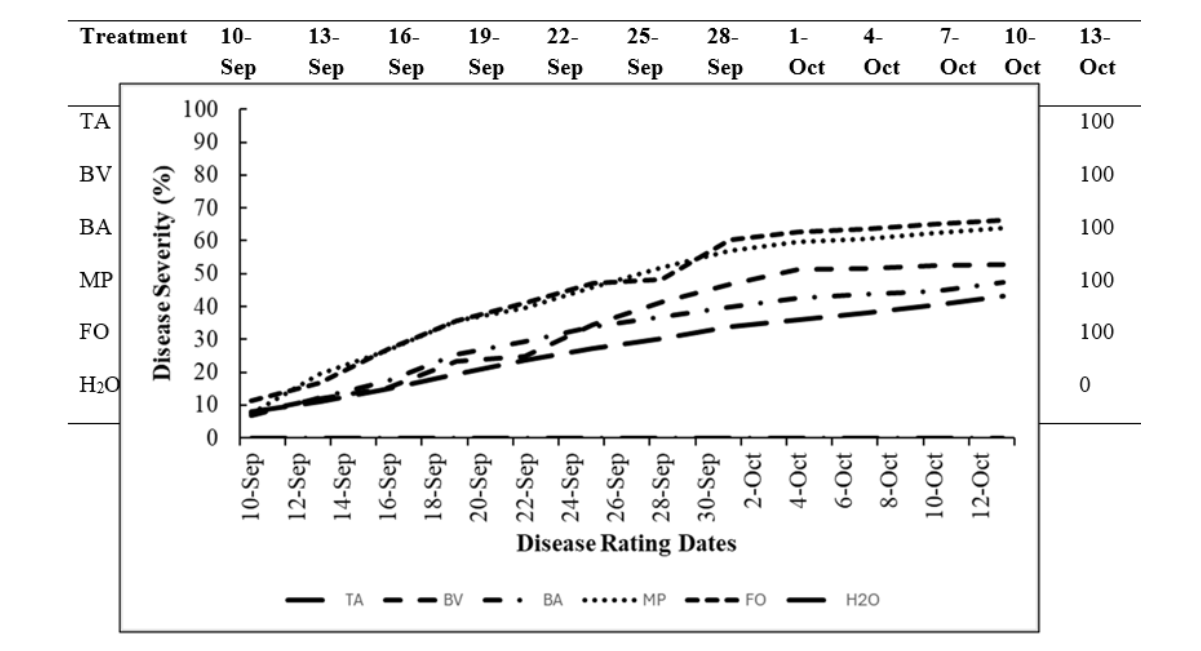
Figure 11: Average Disease Severity Over Time for Various Treatments. The graph illustrates the progression of disease severity (as a percentage, %) measured across different "Disease Rating Dates" (from September 10 to October 12). Disease severity increases for all groups over the monitoring period. The treatments are differentiated by line style: TA (thin solid line), BV (long dashed line), BA (dash-dot line), MP (dotted line), FO (medium dashed line), and H2O (thick solid line). The lines show the relative efficacy of each treatment in managing the disease, with the H2O (water) and FO treatments generally resulting in the highest disease severity, while the TA and BV treatments show lower severity
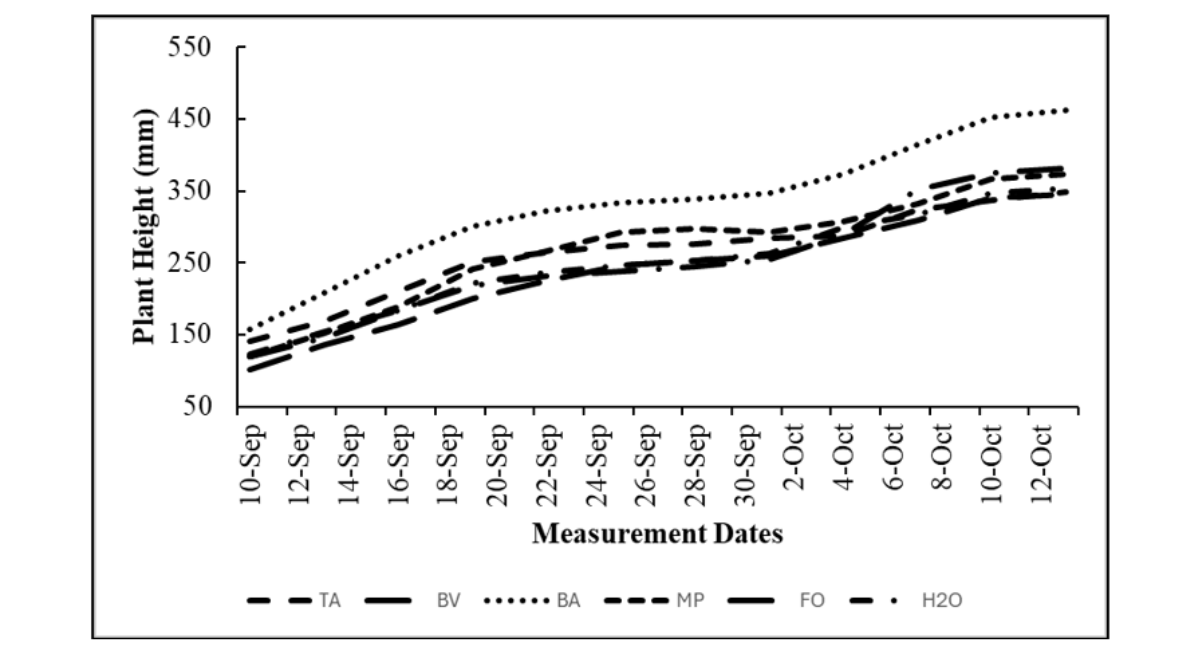
Figure 12: Average Plant Height Over Time for Various Treatments. The graph tracks the mean plant height (measured in millimeters, mm) for different treatments across the "Measurement Dates" (from September 10 to October 12). Plant height consistently increased in all treatment groups throughout the study period. The treatments are represented by line styles: TA (thin solid line), BV (long dashed line), BA (dash-dot line), MP (dotted line), FO (medium dashed line), and H2O (thick solid line). The MP (dotted line) treatment resulted in the greatest overall plant height, suggesting a potential plant growth promotion effect compared to the other treatments, including the control.
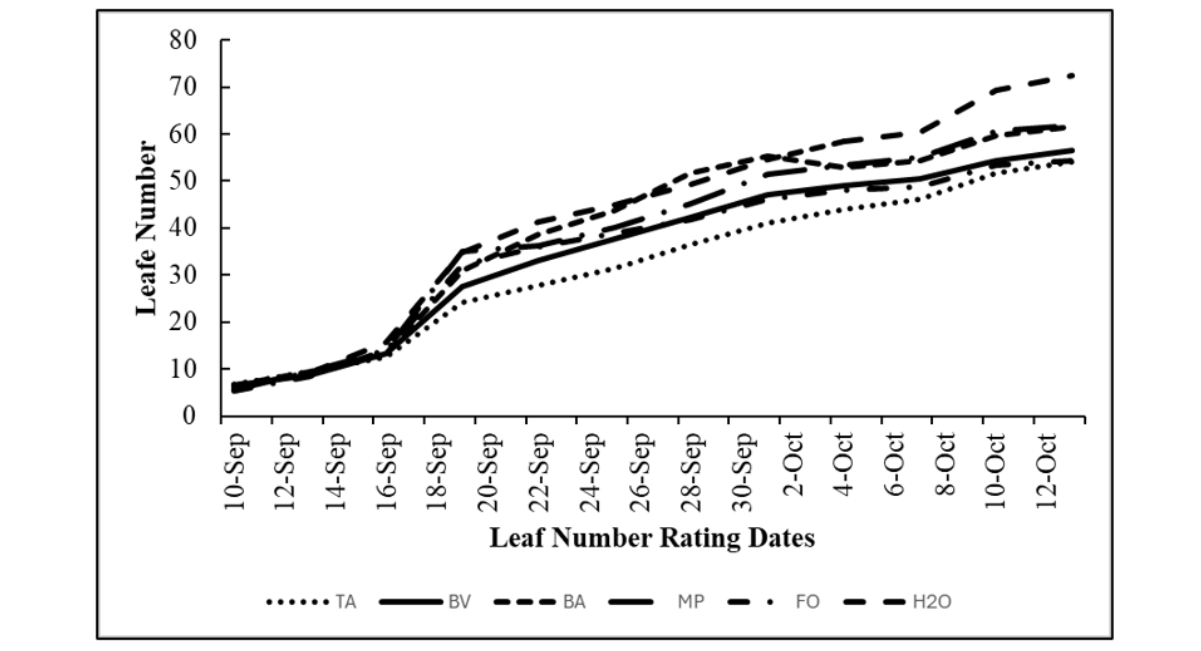
Figure 13: Average Leaf Number Over Time for Various Treatments. The graph presents the mean "Leaf Number" count recorded for different treatments across the "Leaf Number Rating Dates" (from September 10 to October 12). The leaf count increased steadily for all groups throughout the period. The treatments are indicated by line style: TA (dotted line), BV (thick solid line), BA (long dashed line), MP (dash-dot line), FO (medium dashed line), and H2O (thin solid line). The BA and BV treatments resulted in the highest overall leaf counts by the end of the experiment, suggesting they may have a beneficial effect on plant growth, while the TA treatment resulted in the lowest leaf numbers.
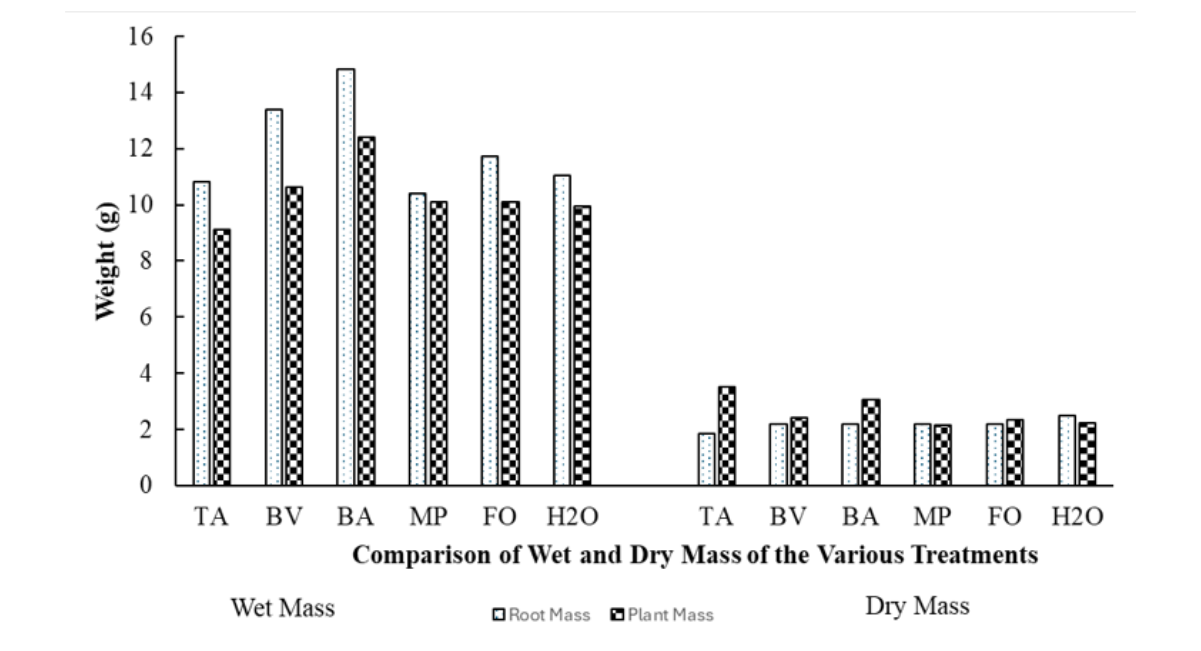
Figure 14: Comparison of Average Wet and Dry Plant Mass Across Various Treatments. The bar graph presents the average Wet Mass and Dry Mass (in grams, g) of the whole plant and roots for six different treatments (TA, BV, BA, MP, FO, and H2O). Within each treatment group, the solid bar represents Root Mass, and the patterned bar represents Plant Mass (shoot). The Wet Mass is significantly higher than the Dry Mass, consistent with water loss from drying the plant and root material for 48 hours in an oven at 65˚ C. The BA treatment generally resulted in the highest overall mass, both wet and dry, while the Dry Mass for the roots and plant across all treatments remained relatively consistent.
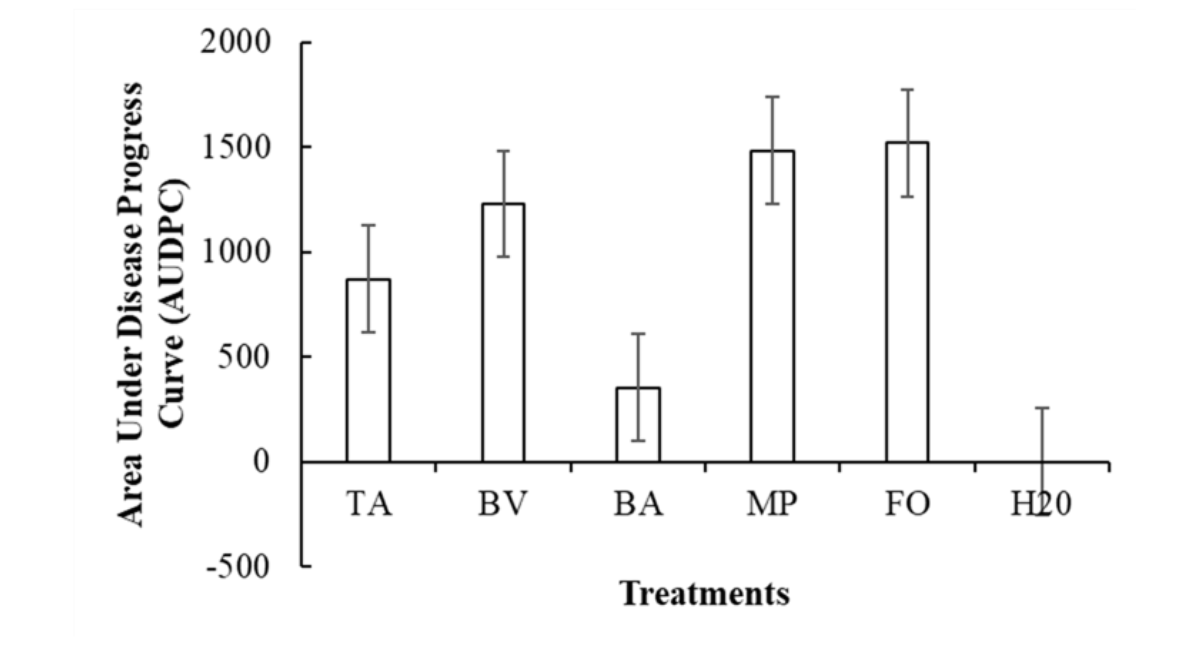
Figure 15: Area Under the Disease Progress Curve (AUDPC) for Various Treatments. The bar graph presents the AUDPC values for six different treatments (TA, BV, BA, MP, FO, and H2O). AUDPC is a measure of the cumulative disease severity over time, with lower values indicating greater disease control. The BA treatment exhibited the lowest positive AUDPC value, suggesting it provided the most effective disease control or suppression among the active treatments. Conversely, the FO and MP treatments resulted in the highest AUDPC values, indicating the greatest disease progression. The H2O control shows a value close to zero or slightly negative, which is unusual for an AUDPC calculation and may represent a baseline or a specific experimental result not following standard calculation conventions, or simply indicates minimal disease in the water control. The error bars represent the variability (e.g., standard deviation or standard error) associated with each mean AUDPC value.
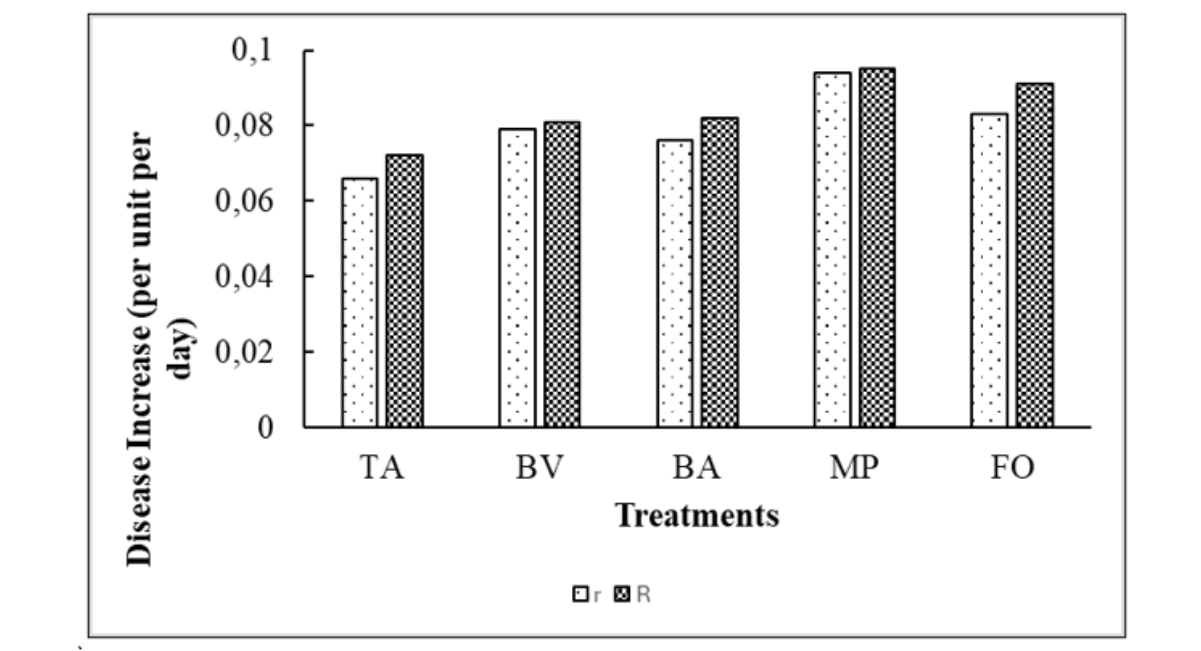
Figure 16: Comparison of Disease Increase Rates (r and R) for Various Treatments. The bar graph illustrates the rate of disease increase (expressed as per unit per) for five different treatments (TA, BV, BA, MP, and FO). The values for r (apparent infection rate, dotted bar) and R (maximum disease increase rate, patterned bar) are presented for each treatment. In all treatments, the R value is marginally higher than the corresponding r value. The MP treatment shows the highest rates for both r and R (approaching 0.1 per unit per day), indicating the fastest progression of the disease. The TA treatment shows the lowest rates for both r and R, suggesting it had the most significant effect in slowing the rate of disease spread compared to the other treatments.
|
Source of variation |
d.f. |
s.s. |
m.s. |
v.r. |
F pr. |
|
Replicate stratum |
2 |
31.46 |
15.73 |
0.36 |
|
|
Replicate.*Units* stratum |
|||||
|
Treatment |
5 |
134 |
26.8 |
0.62 |
0.688 |
|
Residual |
46 |
2002.22 |
43.53 |
||
|
Total |
53 |
2167.69 |
Table 5: Analysis of variance (ANOVA) for root wet mass of Cannabis sativa under different treatments, as computed using Genstat 23rd Edition.
The analysis of variance (Table 5) shows that there were no significant differences (p > 0.05) among treatments in root wet mass of Cannabis sativa . This indicates that the application of the different biological control agents and combinations did not significantly affect the water-holding capacity or fresh weight of the roots. Although numerical variations were observed between treatments, these were not statistically meaningful, suggesting that the treatments maintained a relatively similar influence on belowground biomass accumulation under the experimental conditions
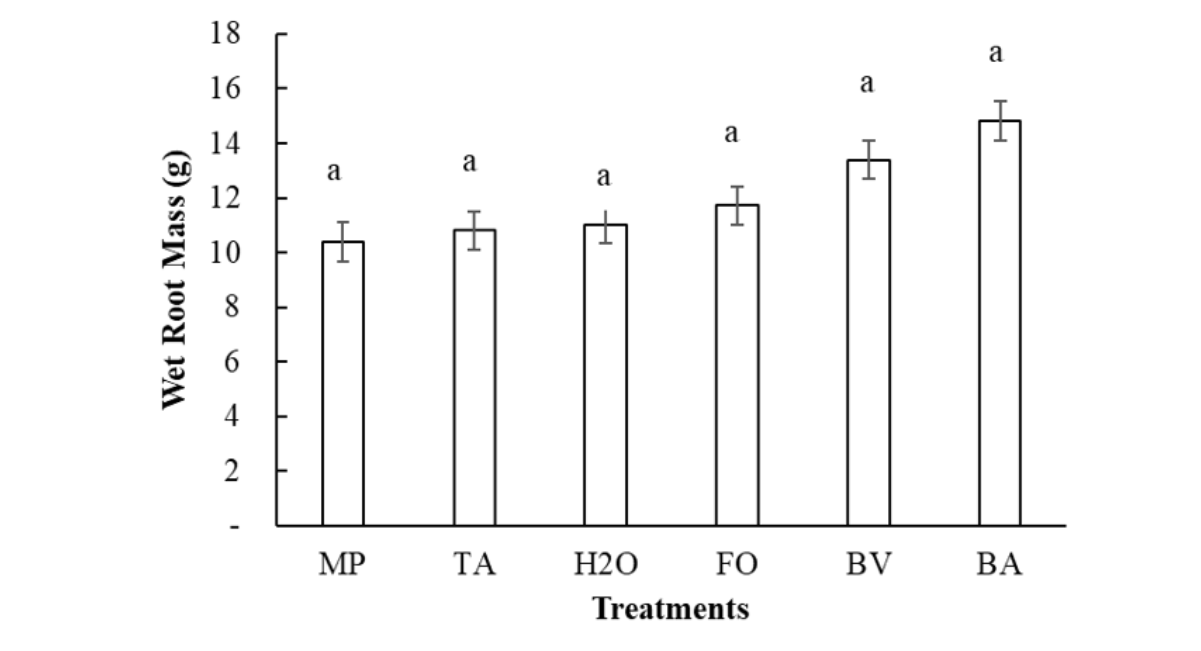
Figure 17: Mean root wet mass (g) of Cannabis sativa under different treatments. Error bars represent the standard error of the mean (±SE). Bars with the same letter indicate no significant difference (p > 0.05) according to the Duncan’s Multiple Range Test (DMRT).
Figure 17 illustrates the mean root wet mass of Cannabis sativa plants subjected to different treatments. The error bars represent the standard error of the mean (±SE), and the absence of different letters above the bars indicates no significant differences according to Duncan’s Multiple Range Test (DMRT). Overall, the figure shows that root wet mass remained relatively consistent across treatments, suggesting that the various microbial inoculations and control treatments had a comparable effect on root moisture and development. This consistency may imply that all treatments supported similar water uptake and retention capacity in the roots.
|
Source of variation |
d.f. |
s.s. |
m.s. |
v.r. |
F pr. |
|
Replicate stratum |
2 |
31.96 |
15.98 |
1.03 |
|
|
Replicate.*Units* stratum |
|||||
|
Treatment |
5 |
54.79 |
10.96 |
0.71 |
0.621 |
|
Residual |
46 |
712.34 |
15.49 |
||
|
Total |
53 |
799.09 |
Table 6: Analysis of variance (ANOVA) for plant mass of Cannabis sativa under different treatments, as computed using Genstat 23rd Edition.
The ANOVA results in Table 6 indicate that there were no significant differences (p > 0.05) in plant wet mass among the six treatments tested. This finding suggests that the treatments had little to no measurable effect on the total fresh biomass accumulation of Cannabis sativa . The uniformity in wet mass values implies that plant growth and water content in aerial tissues (stems and leaves) were not significantly influenced by the application of biological control agents compared to the untreated control.
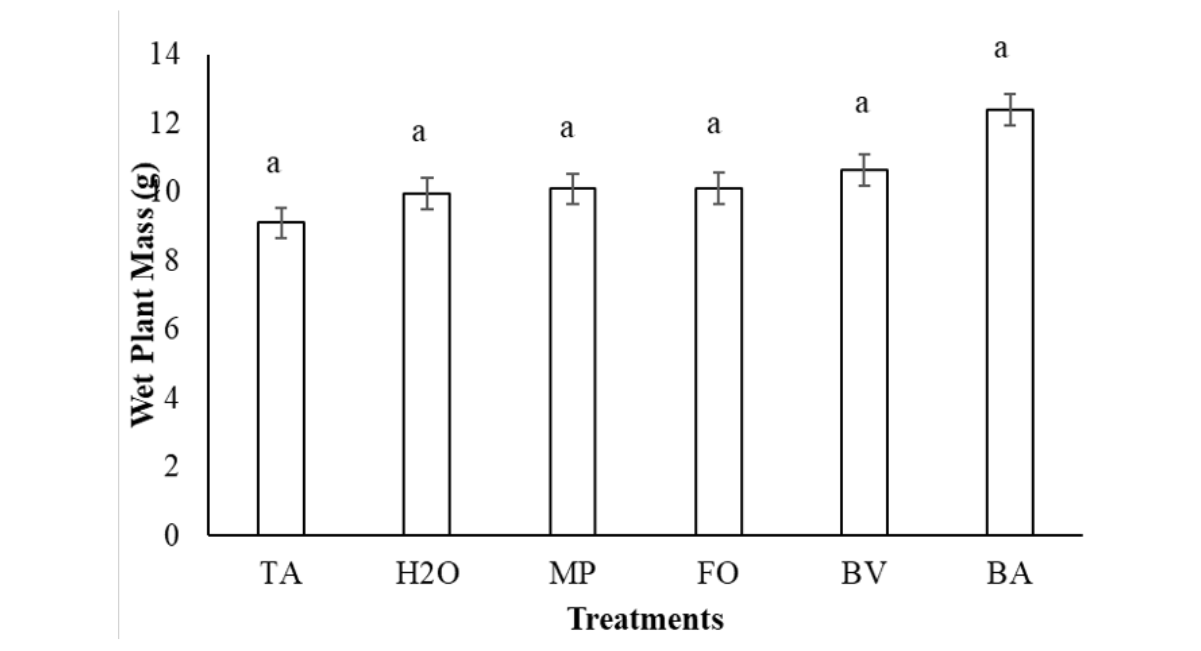
Figure 18: Mean plant wet mass (g) of Cannabis sativa under different treatments. Error bars represent the standard error of the mean (±SE). Bars with the same letter indicate no significant difference (p > 0.05) according to the Duncan’s Multiple Range Test (DMRT).
As shown in Figure 18, the mean plant wet mass of Cannabis sativa exhibited minimal variation among treatments, with no significant differences detected by DMRT (p > 0.05). The graph shows that all treatments resulted in comparable levels of fresh plant biomass, reflecting similar growth responses under the same environmental conditions. The consistent pattern of wet mass suggests that while the microbial treatments may have contributed to plant vigor, their effects on overall plant hydration and mass accumulation were not statistically distinct.
|
Source of variation |
d.f. |
s.s. |
m.s. |
v.r. |
F pr. |
|
Replicate stratum |
2 |
0.341 |
0.171 |
0.12 |
|
|
Replicate. *Units* stratum |
|||||
|
Treatment |
5 |
5.813 |
1.163 |
0.81 |
0.547 |
|
Residual |
46 |
65.813 |
1.431 |
||
|
Total |
53 |
71.967 |
Table 7: Analysis of variance (ANOVA) for root dry mass of Cannabis sativa under different Edition treatments, as computed using Genstat 23rd Edition According to the ANOVA results in Table 7, there were no statistically significant differences (p > 0.05) in root dry mass among the treatments. This indicates that the treatments did not significantly alter the accumulation of dry matter in Cannabis sativa roots. The close similarity in mean square and sum of squares values across treatments suggests a uniform effect, where each treatment supported comparable root biomass production after drying, implying that microbial inoculation had a neutral effect on root structural growth.
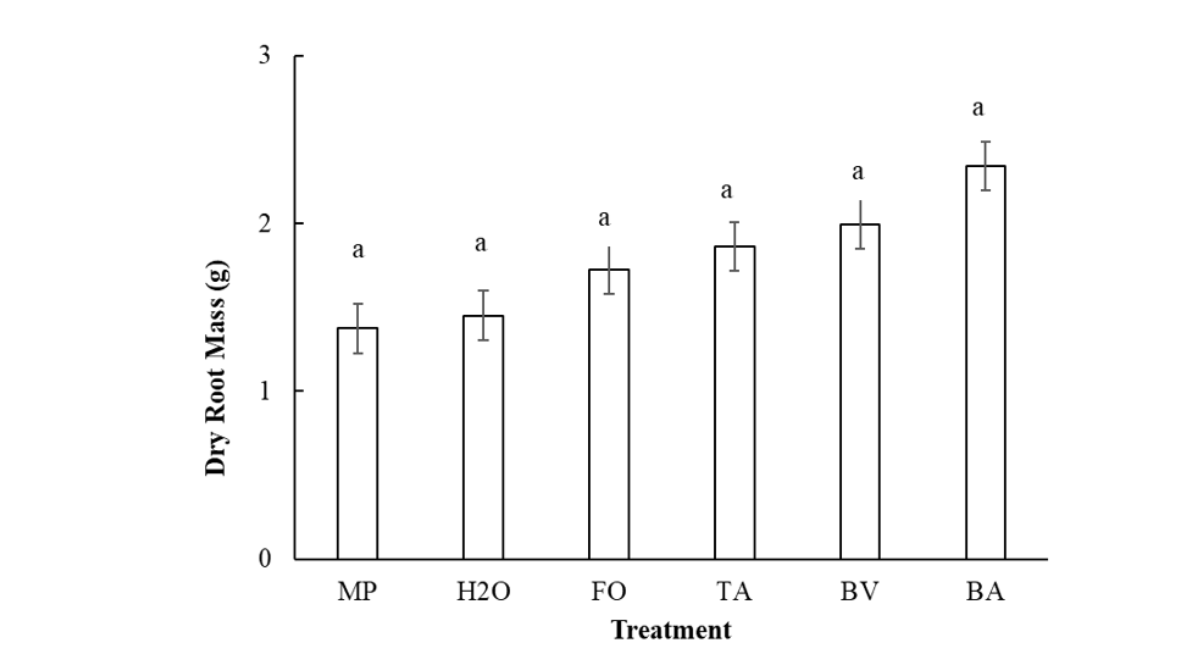
Figure 19: Mean root dry mass (g) of Cannabis sativa under different treatments. Error bars represent the standard error of the mean (±SE). Bars with the same letter indicate no significant difference (p > 0.05) according to the Duncan’s Multiple Range Test (DMRT).
Figure 19 presents the mean root dry mass values for Cannabis sativa under the different treatments. The results show a similar trend across all treatments, with overlapping error bars and no significant differences according to DMRT. These findings suggest that the treatments did not differentially affect root biomass accumulation after moisture removal. The data imply that despite the potential for plant growth-promoting microorganisms to enhance nutrient uptake and root development, their influence on final dry root mass under the given conditions was not significant.
Table 8: Analysis of variance (ANOVA) for plant dry mass of Cannabis sativa under different treatments, as computed using Genstat 23rd Edition.
|
Source of variation |
d.f. |
s.s. |
m.s. |
v.r. |
F pr. |
|
Replicate stratum |
2 |
6.459 |
3.23 |
1.8 |
|
|
Replicate.*Units* stratum |
|||||
|
Treatment |
5 |
4.824 |
0.965 |
0.54 |
0.746 |
|
Residual |
46 |
82.484 |
1.793 |
||
|
Total |
53 |
93.767 |
Table 8: Analysis of variance (ANOVA) for plant dry mass of Cannabis sativa under different treatments, as computed using Genstat 23rd Edition. The ANOVA results in Table 8 reveal that there were no significant differences (p > 0.05) in total plant dry mass among treatments. This suggests that the various treatments, including biological control agents, did not significantly influence the total dry biomass yield of Cannabis sativa. The uniformity across replicates and treatments indicates that the plants maintained consistent growth and dry matter partitioning, regardless of the microbial treatments applied.
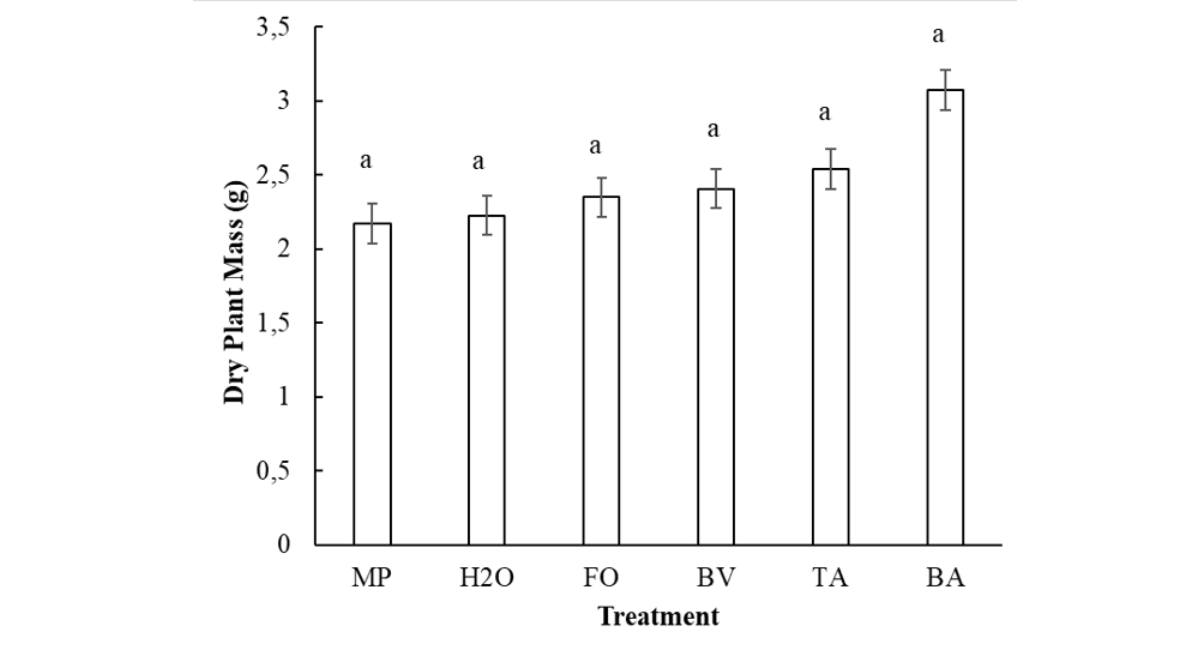
Figure 20: Mean plant dry mass (g) of Cannabis sativa under different treatment Error bars represent the standard error of the mean (±SE). Bars with the same letter indicate no significant difference (p > 0.05) according to the Duncan’s Multiple Range Test (DMRT).
Figure 20 shows the mean plant dry mass across treatments, with error bars representing the standard error of the mean. All treatments exhibited statistically similar dry mass values, as confirmed by DMRT (p > 0.05). The data indicate that treatment application had no substantial effect on dry biomass production in Cannabis sativa. This suggests that, under the experimental conditions, the biological control agents neither enhanced nor reduced the accumulation of dry matter in the plants, and plant growth remained relatively uniform across treatments.
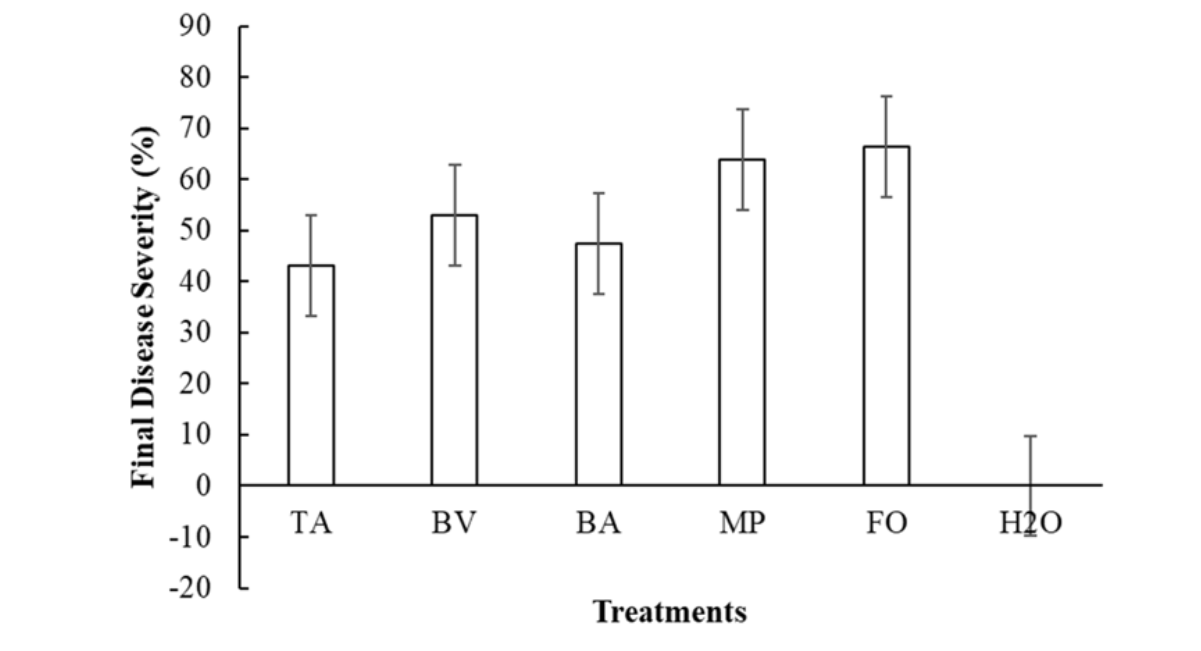
Figure 21: Effect of various treatments (e.g., T. asperellum (TA), B. velezensis (BV), B. amyloliquefaciens (BA), M. proteolyticum (MP), F. oxysporum (FO), and water control (H2O) on the final disease severity percentage of F. oxyporum in C. sativa. Error bars represent the standard error of the mean.
The graph (Figure 21) compares the final disease severity across six different treatments. The highest disease severity percentages (over 60%) were observed for treatments MP and FO, with FO showing the maximum severity, suggesting they represent the conditions most conducive to disease or the application of the pathogen. Treatments TA, BV, and BA resulted in moderate disease severity (ranging from approximately 43% to 53%), indicating a partial effect. In contrast, the Water control exhibited negligible disease severity (0%), confirming the baseline disease level in the absence of the applied treatments or inoculum.
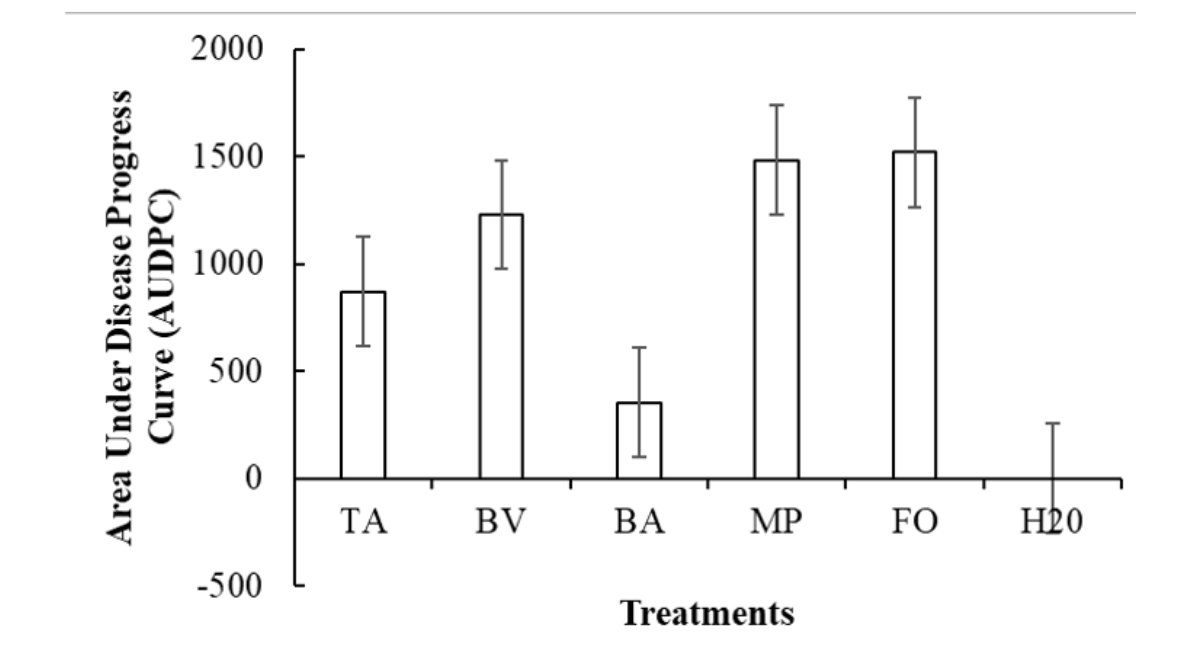
Figure 22: Area Under the Disease Progress Curve (AUDPC) values for Cannabis sativa plants subjected to different treatments. Treatments include Trichoderma asperellum (TA), Bacillus velezensis (BV), Bacillus amyloliquefaciens (BA), Microbacterium proteolyticum (MP), Fusarium oxysporum inoculated positive control (FO), and water-treated negative control (H₂O). Error bars represent the standard deviation of the mean. Lower AUDPC values indicate reduced disease progression and improved disease suppression.
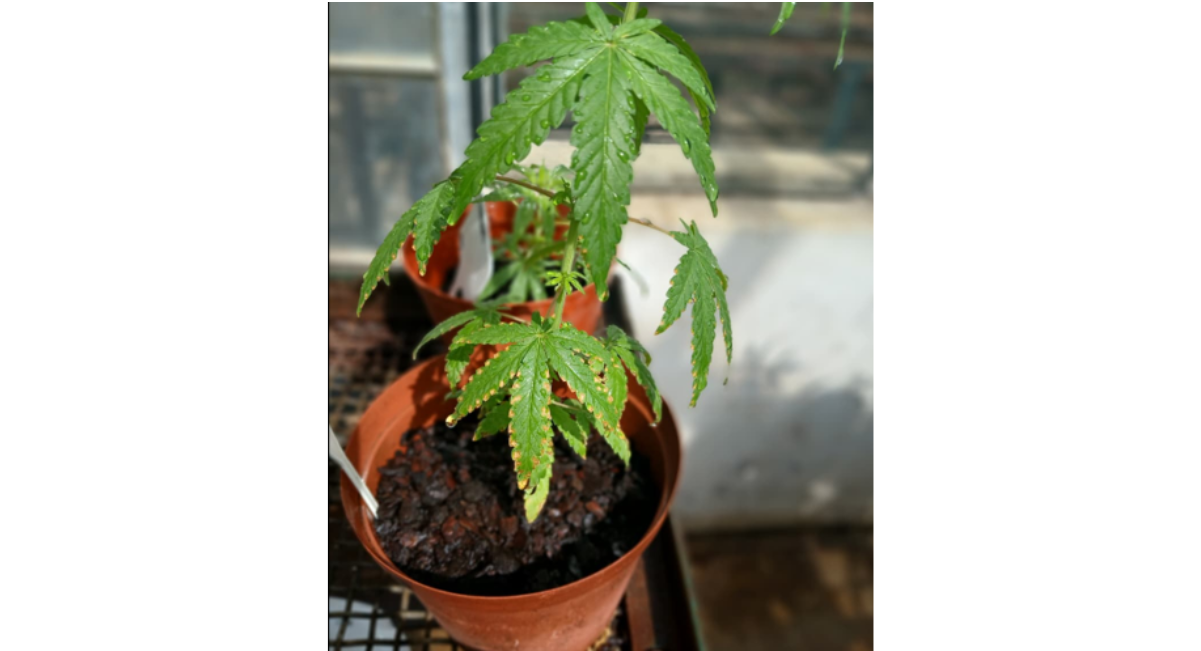
Figure 23: Symptoms of Fusarium wilt on Bergville Cannabis species leaves in a greenhouse setting. Note the characteristic chlorosis (yellowing) and necrotic lesions (brown, dead spots) forming on the leaf margins and spreading inward.
DISCUSSION
The present study shows that plant growth-promoting microorganisms can meaningfully suppress Fusarium oxysporum in Cannabis sativa, but their effects are not uniform across in vitro and in vivo conditions. The dual-culture results in Figure 1 and the bacterial antagonism setup in Figure 2 showed that all four microorganisms inhibited pathogen growth, and the ANOVA confirmed highly significant treatment effects on mycelial growth at 3, 5 and 7 days. The SEM images strengthen this pattern: Figures 4 and 5 confirm the typical smooth, septate hyphae and conidia of F. oxysporum, while Figures 6 to 8 show hyphal coiling, surface colonisation, bacterial adhesion and biofilm-like material, all of which are consistent with direct antagonism rather than simple growth delay. This aligns well with previous microscopy work showing Trichoderma asperellum coiling around Fusarium hyphae and causing attachment and cell-wall disintegration (Sonkar, 2019), and with broader reviews describing biocontrol through direct antimicrobial activity, competition for space and nutrients, and induced resistance (Boulahouat, Ramirez and Sanchez, 2023).
Among the fungal antagonists, T. asperellum behaved as expected for a classic mycoparasite: its inhibition was slower than that of the bacterial isolates, but the interaction zone and SEM images suggest that its mode of action depended on physical contact and hyphal parasitism rather than rapid overgrowth. That interpretation is consistent with earlier cannabis and non-cannabis reports showing Trichoderma to be effective against Fusarium through pre-emptive colonisation and direct antagonism (Pellegrini, Ercole and Villa, 2021; Scott and Punja, 2023). In greenhouse cannabis trials, Trichoderma-based products reduced Fusarium disease severity, although the effect depended on product and timing (Scott and Punja, 2023), which matches the observation that T. asperellum reduced disease progression but did not produce the strongest Area Under the Disease Progress Curve (AUDPC) reduction in this experiment.
The Bacillus treatments appear to be the strongest candidates overall for suppressing disease progression. In this greenhouse trial, Bacillus amyloliquefaciens gave the lowest AUDPC, while B. velezensis also reduced disease advancement and improved leaf number and vegetative vigour. That pattern is biologically plausible because Bacillus spp. are well known to act through lipopeptide production, antibiosis, competition and induced systemic resistance, and cannabis studies have already shown strong suppression of fungal pathogens by Bacillus velezensis and related strains (Balthazar et al., 2021; Boulahouat, Ramirez and Sanchez, 2023; Corredor-Perilla, Martinez-Chavez and Restrepo, 2023). In particular, cannabis-associated Bacillus isolates have previously shown clear inhibition of F. oxysporum in vitro, and B. velezensis has performed well against several cannabis fungal pathogens in planta (Balthazar et al., 2021; Corredor-Perilla, Martinez-Chavez and Restrepo, 2023), which supports the performance observed in Figures 15 and 16.
The case of Microbacterium proteolyticum is more nuanced. It promoted the greatest plant height, yet it did not translate into the strongest disease suppression, suggesting that growth promotion and biocontrol were partly uncoupled under these experimental conditions. That is an important result, because it implies that a microbe can improve vegetative growth without necessarily providing the most reliable protection against Fusarium wilt. The biomass data in Figures 17 to 20 support this interpretation: root wet mass, plant wet mass, root dry mass and total plant dry mass did not differ significantly among treatments, so the clearest treatment effects were on disease development and some aboveground growth traits rather than final biomass accumulation. Under a 40-day greenhouse challenge, that is not surprising; disease suppression may need a longer period, lower inoculum pressure, or repeated application before it becomes visible as a biomass gain.
The disease progression graphs reinforce this picture. Figure 11 shows that disease severity increased in all inoculated groups, including those pretreated with antagonists, which means none of the biological agents fully prevented infection under the challenge conditions used here. What they did achieve was slowing the epidemic, and that is reflected most clearly in the lower AUDPC and slower disease increase rates for B. amyloliquefaciens, T. asperellum and B. velezensis in Figures 15 and 16. In practical terms, this suggests that these agents are better interpreted as suppressive or protective inputs rather than as complete stand-alone controls. That conclusion fits the broader cannabis literature, where biopesticides are available but efficacy data are still limited, and where the best results have generally come from preventive rather than curative application (Gwinn, Hansen and Ownley, 2022; Scott and Punja, 2023).
Taken together, the study adds useful crop-specific evidence for biological control in cannabis. The strongest overall message is that B. amyloliquefaciens and B. velezensis were the most effective suppressors of F. oxysporum disease progress in this system, while T. asperellum showed clear antagonistic capacity and M. proteolyticum appeared more growth-promoting than strongly protective. The figures make that pattern easy to follow: Figures 1, 2 and 6 to 8 document direct antagonism in vitro, Figures 11, 15 and 16 show slowed disease development in vivo, and Figures 17 to 20 show that these effects did not yet translate into significant differences in final biomass. That combination of findings suggests real promise, but also shows that strain identity, timing and formulation will matter if these microorganisms are to be used successfully in greenhouse cannabis production.
CONCLUSION
This study demonstrates that plant growth-promoting microorganisms can suppress Fusarium oxysporum in Cannabis sativa, but the magnitude of control depends strongly on the organism used. Bacillus amyloliquefaciens gave the best overall disease suppression, B. velezensis also performed well, and T. asperellum showed clear mycoparasitic activity and moderate control. Microbacterium proteolyticum improved plant height but did not provide comparable disease suppression, indicating that growth promotion and biocontrol are not necessarily the same trait under greenhouse challenge.
The SEM and dual-culture data support the conclusion that these antagonists act through different mechanisms, including coiling, adhesion, colonisation and likely antibiosis. Even though all inoculated plants became diseased, the biological treatments slowed disease progression and reduced AUDPC relative to the pathogen control. On that basis, B. amyloliquefaciens, B. velezensis and T. asperellum should be considered promising components of an integrated management strategy for Fusarium wilt in cannabis, especially where registered chemical options are limited.
DECLARATION
FUNDING
The authors declare that no funds, grants, or other support were received during the preparation of this manuscript.
COMPETING INTERESTS
The authors have no relevant financial or non-financial interests to disclose.
Author Contributions: All authors contributed to the study conception and design. SM served as the main author, developed the methodology, and conducted the experimental work. NCM contributed as a co-author, providing critical proofreading and final edits. All authors have read and approved the final manuscript.
Ethics, Consent to Participate, and Consent to Publish declarations: Not applicable.
Data Availability: The datasets generated during and/or analysed during the current study are available from the corresponding author on reasonable request.
REFERENCES
- Li Z, He F, Gai X, Zhu H, He S, Xuan YH, et.al. The growth, development and infection process of the plant pathogen Fusarium. Plant Signaling & Behavior. 2025 Dec 31;20(1): 2573097. [Crossref] [Google Scholar] [PubMed]
- Balthazar C, Novinscak A, Cantin G, Joly DL, Filion M . Biocontrol activity of Bacillus spp. and Pseudomonas spp. against Botrytis cinerea and other cannabis fungal pathogens. Phytopathology®. 2022 Mar 25;112(3):549-60..[Crossref][Google Scholar][PubMed]
- Maharaj S, Mbili NC. Effect of plant growth-promoting microorganisms against Fusarium oxysporum in Cannabis sativaAvailable at SSRN 6913439.[Google Scholar.
- ]Punja ZK, Collyer D, Scott C, Lung S, Holmes J, Sutton D. Pathogens and molds affecting production and quality of Cannabis sativa L. Frontiers in plant science. 2019 Oct 17;10:1120.[Crossref][Google Scholar][PubMed]
- Punja ZK. Emerging diseases of Cannabis sativa L (marihuana) in Canada. InInternational Congress of Plant Pathology (ICPP) 2018: Plant Health in A Global Economy 2018 Aug 1. APSNET.[Google Scholar].
- Buirs L, Punja ZK . Integrated management of pathogens and microbes in Cannabis sativa L.(Cannabis) under greenhouse conditions. Plants. 2024 Jan;13(6):786.[Crossref][Google Scholar][PubMed]
- Barbieri CR . Biológicos no controle de doenças, indução de resistência e promoção de crescimento na cultura da soja.[Google Scholar].